2. 中国科学院大学,北京 100049
土壤生物有效磷的充足供给是维持山地生态系统稳定的基础,然而,目前仍不清楚其随海拔梯度的变化特征及其主要影响因素。土壤生物有效磷含量受成土母质[1]、成土时间[2]、气候[3]、生物活动[4]和土壤理化性质[5]等因素共同影响。具有较大高差的山地是研究上述因素变化对生态系统磷(P)生物有效性的综合作用及评估各因素对土壤生物有效磷时空分布相对重要性的理想场所。Sundqvist[6]、Vincent[3]和Vitousek[7]等对山地土壤的研究发现,随海拔升高,温度降低导致微生物分解速率减慢,生物有效磷含量呈降低趋势。Mukai等[8]在日本Yakushima的研究发现,在高海拔冷、湿环境下,土壤湿度过大和较低的土壤pH加速了P淋溶流失。然而,Unger等[9]在厄瓜多尔东北部的研究发现,有机质层和矿质层中生物有效磷库随海拔升高(温度降低)而增大,其主要原因是随海拔升高,植物对P的需求量逐渐降低,从而导致土壤生物有效磷逐渐积累。Zhou等[10]对贡嘎山东坡6种植被带的研究发现,随海拔升高,土壤生物有效磷的浓度和储量呈“抛物线”型分布,亚高山针叶林土壤生物有效磷的浓度和储量最大,温度、土壤pH和凋落物产量是影响生物有效磷空间分布的主要因素。可见,目前有关土壤生物有效磷随海拔梯度的变化模式和主要影响因素还存在较多争论。因此,有必要开展更多的相关研究,为阐明山地土壤生物有效磷的时空分异提供案例。
贡嘎山东坡亚高山海拔2 600~3 200 m的峨眉冷杉林是开展土壤生物有效磷垂直分异和季节变化特征研究的理想场所。本区土壤母质和植被类型差异较小,温度和降水存在明显的梯度差异[11-12]。随海拔升高,土壤温度降低,有机磷(Po)矿化速率减慢,则生物有效磷含量应逐渐减少[3, 6-7]。然而,本研究区是贡嘎山东坡降雨量最大的区域[11],如果考虑由海拔引起的径流差异对土壤生物有效磷的影响,则对生物有效磷的海拔分布和季节变化特征的预测将更加困难。本研究分别利用湿化学浸提法[13]和Bowman等[14]原位树脂袋包埋法测定贡嘎山东坡峨眉冷杉林(2 600~3 200 m)土壤生物有效磷含量和供给量,以阐明土壤生物有效磷的海拔分布和季节变化特征以及影响该区土壤生物有效磷时空分异的主要因素。
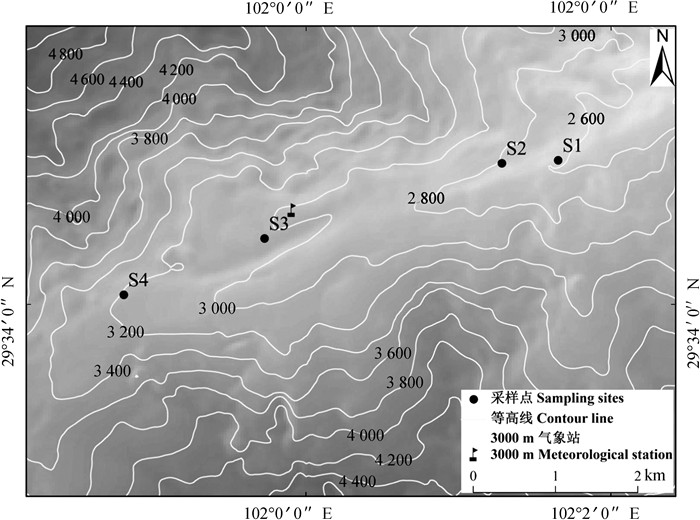
1 材料与方法 1.1 研究区概况贡嘎山位于青藏高原和四川盆地的交界处,最高峰海拔7 556 m(图 1),由于相对高差达6 km,各种环境要素随海拔发生急剧变化,形成完整的土壤和植被带谱[12]。针叶林在贡嘎山地区分布范围最广,是最重要的植被类型之一,东坡海拔2 600~3 200 m是峨眉冷杉林带[12]。贡嘎山东坡主要受东亚季风影响,根据中国科学院贡嘎山站(3 000 m)的观测,该区年平均气温4.2℃,1月平均气温-4.6℃,7月平均气温12.5℃,年降雨量约为1 947 mm,年相对湿度为90%左右,年蒸发量约为327 mm[15]。6—10月为生长季,植物根系和微生物活动剧烈;11月至次年5月为非生长季,植物和微生物基本处于休眠状态[16]。土壤成土母质主要为花岗岩,由低海拔至高海拔发育了山地棕壤(2 600~2 800 m)和山地暗棕壤(2 800~3 200 m)[12]。

|
图 1 研究区位置及采样点分布 Fig. 1 Location of the study area and distribution of sampling sites |
2016年5月在贡嘎山东坡海拔2 628 m (S1)、2 781 m (S2)、3 044 m (S3)和3 210 m (S4)的峨眉冷杉林下共设置4个采样点(表 1),每个采样点选择坡度较小的坡中挖掘6个土壤剖面,每个剖面间距大于10 m。土壤剖面由上至下分为:分解强烈的凋落物层(O层)、淋溶层(A层)、淀积层(B层)和母质层(C层)。按土壤发生层由下至上依次采集各层容重和土壤样品。参照Maynard和Curran[17]提出的容重样品采集方法,有机层利用薄膜法,矿质层利用环刀法(体积为100 cm3)。用小铲采集土壤样品,每一层采集鲜重土壤1~2 kg。所有样品采集后均用干净的聚乙烯袋封装,低温带回实验室储存于4℃。
|
|
表 1 采样点概况 Table 1 General characteristics of the sampling sites |
将10 g阴阳离子混合交换树脂(Lewatit NM-60 H+/OH-)封装于60目尼龙袋(10 cm × 10 cm)。参照Bowman等[14]原位树脂袋包埋法,将树脂袋埋入每一土层,每个采样点选择剖面1~4。埋置时间为2016年5月至2017年5月,其中2016年6月至10月每月收集树脂袋一次,11月至次年5月收集一次。收集的树脂储存于4℃保温箱中,一周内完成测试。
原位连续监测每个采样点剖面1~3的O、A和B层的土壤温度变化(温度计型号:Maxim DS 1923, USA)。
1.3 样品分析土壤pH采用电极法测定,O层和矿质土层水土比分别为10:1和2.5:1。无定形铁Feox和无定形铝Alox浓度采用草酸-草酸铵法提取[20],用ICP-OES(PerkinElmer Optima 8300, USA)测定,检测限均为0.001 mg·L-1。全碳TC和全氮TN浓度用元素分析仪(Vario Isotope Cube, Germany)测定,检测限分别为0.050%和0.015%。全磷TP浓度参照钼锑抗比色法利用UV2450紫外可见分光光度计(Shimadzu, Japan)测定[21],检测限为0.01 mg·L-1。TP和无机磷Pi之差为有机磷Po浓度[13]。土壤微生物生物量磷MBP采用氯仿熏法测定[22]。磷酸酶活性采用对硝基苯磷酸盐法测定[23]。
1.4 生物有效磷测定利用室内分析和野外原位监测2种方式测定土壤生物有效磷。
室内分析:称0.5 g风干土样,用30 mL 0.5 mol·L-1 NaHCO3浸提[13]。为避免风干效应造成土壤生物有效磷含量偏高[24],本研究将NaHCO3提取的无机态磷(NaHCO3-Pi)作为室内湿化学提取测定的生物有效磷含量(Bio-PL),mg·kg-1。参照Zhou等[10]的方法,O层和0~50 cm矿质土层Bio-PL的储量(StockBio-PL),kg·hm-2:
| $ {\rm{stoc}}{{\rm{k}}_{{\rm{Bio - }}{{\rm{P}}_{\rm{L}}}}} = \left[ \begin{array}{l} {C_{\rm{O}}} \times {D_{\rm{O}}} \times {T_{\rm{O}}} + {C_{\rm{A}}} \times {T_{\rm{A}}} + {C_{\rm{B}}} \times {D_{\rm{B}}} \times {T_{\rm{B}}}\\+ {C_{\rm{C}}} \times {D_{\rm{C}}} \times \left( {50 - {T_{\rm{A}}} - {T_{\rm{B}}}} \right) \end{array} \right]/10 $ | (1) |
式中,CO、CA、CB和CC分别表示O层、A层、B层和C层的Bio-PL浓度,mg·kg-1;DO、DA、DB和DC分别表示4个土层的土壤容重,g·cm-3;TO、TA和TB分别表示3个土层的厚度,cm。
原位监测:用2 mol·L-1 KCl按1:10的树脂:浸提剂(重量:体积)浸提树脂吸附的P[14]。然后利用AutoAnalyzer 3流动分析仪(Seal Analytical, Germany)测定浸提液中PO43-浓度。用单位质量树脂每天吸附的P表征原位树脂袋包埋法测定的土壤生物有效磷供给量(Bio-PS),mg·kg-1·d-1:
| $ {\rm{Bio - }}{{\rm{P}}_{\rm{S}}} = \frac{{\left( {{C_{\rm{t}}} - {C_0}} \right) \times V}}{{M \times D}} $ | (2) |
式中,Bio-PS表示土壤中的活性磷经输入(岩石风化、Po矿化和矿物及黏粒解吸等)与损耗(生物体吸收、矿物及黏粒吸附和随径流流失等)后土壤可交换态磷每天的供给量;C0和Ct分别表示空白树脂与野外掩埋后回收树脂的浸提液中PO43--P浓度,mg·kg-1;V表示浸提液体积,mL;M为树脂质量,g;D表示树脂袋包埋时长,d。
1.5 数据统计利用Shapiro-Wilk检验数据符合正态分布(P > 0.05)。利用单因素方差分析(One-way ANOVA)判识不同土层和不同海拔土壤属性是否存在显著差异(P < 0.05)。利用Spearman相关分析探讨不同土层和不同海拔土壤属性之间的相关关系(P < 0.05)。
2 结果 2.1 土壤性质的空间变化由表 2可知,随海拔升高,各层土壤温度显著降低(P < 0.05)。除A层外,其他各层土壤含水量均在S2样点最高。除C层外,其他各层土壤pH均在S2样点最小。O层和A层Feox浓度均在S2样点最低,但B层和C层Feox浓度均在S2样点最高。各层Alox浓度均在S3样点最低。除A层外,其他各层土壤TC和TN浓度随海拔升高而降低,但均在S2样点最高。
|
|
表 2 贡嘎山东坡峨眉冷杉林土壤性质 Table 2 Soil properties of the sampling sites in the Abies fabri (Mast.) Craib forest on Mt. Gongga |
随土层深度增加,土壤温度逐渐降低。O层土壤含水量显著高于矿质层(P < 0.05)。A层土壤pH小于其他各层,均值为4.6。Feox和Alox浓度均值在O层最低,B层最高。TC、TN和MBP浓度及磷酸酶活性随土层深度增加均有降低趋势。
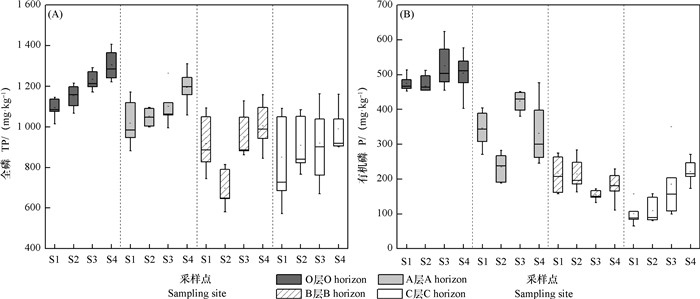
2.2 土壤全磷和有机磷的空间变化随海拔升高,亚高山土壤O层和A层的TP浓度均逐渐增大(图 2a);S2样点B层的TP浓度显著低于其他样点;4个样点的C层TP浓度无显著性差异(P > 0.05)。与TP相比,Po梯度变化趋势较复杂(图 2b)。O层和C层Po浓度随海拔升高有增大趋势,而B层Po浓度梯度变化趋势则相反,S2样点A层的Po浓度显著低于其他样点(P < 0.05)。随土层深度增加,TP和Po浓度均有降低趋势。

|
图 2 贡嘎山东坡峨眉冷杉林土壤TP(a)和Po(b)浓度的梯度变化 Fig. 2 Changes of soil TP (a) and Po (b) with altitude in the Abies fabri (Mast.) Craib forest on Mt. Gongga |
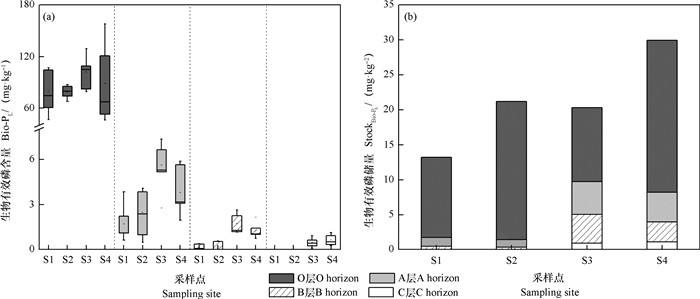
低海拔地区(S1和S2样点)土壤Bio-PL浓度显著低于高海拔地区(S3和S4样点)(P < 0.05)(图 3a)。随土层深度增加,Bio-PL浓度显著降低(P < 0.05)。随海拔升高,StockBio-PL有增大趋势(图 3b)。O层StockBio-PL显著高于其他土层(P < 0.05),约占土壤剖面总StockBio-PL的75%。

|
图 3 贡嘎山东坡峨眉冷杉林土壤生物有效磷含量(a)和生物有效磷储量(b)的梯度变化 Fig. 3 Changes of Bio-PL (a) and StockBio-PL (b) with altitude in the Abies fabri (Mast.) Craib forest on Mt. Gongga |
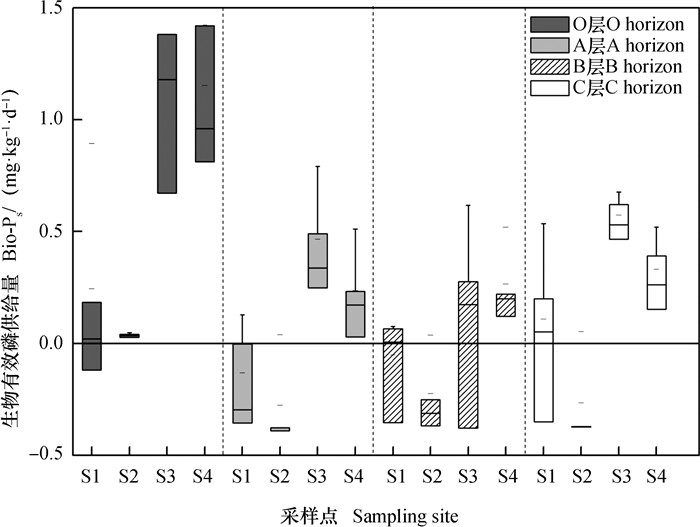
与Bio-PL梯度变化一致,随海拔升高,Bio-PS呈增大趋势,且均在S3样点最大(图 3a和图 4);但Bio-PS最小值出现在S2样点。O层Bio-PS均为正值;低海拔地区Bio-PS在矿质土层出现负值,此时的土壤并未释放生物有效磷,而是处于吸附生物有效磷的状态。

|
图 4 贡嘎山东坡峨眉冷杉林土壤Bio-PS梯度变化(2016年6月) Fig. 4 Changes of Bio-PS with altitude in the Abies fabri (Mast.) Craib forest on Mt. Gongga (June, 2016) |
各样点O层土壤Bio-PS全年均为正值(图 5a)。S1样点O层Bio-PS无显著季节变化(P > 0.05)。S2样点Bio-PS在9—10月较大,其他月份的均值约为0 mg·kg-1·d-1(“单峰”)。S3和S4样点Bio-PS的季节变化均呈“双峰”(6月和9月是两个峰值点),两者Bio-PS最低值均出现在11月至次年5月(非生长季)。

|
图 5 贡嘎山东坡峨眉冷杉林O层(a)、A层(b)和B层(c)土壤Bio-PS的季节变化 Fig. 5 Seasonal variations of Bio-PS in the O horizon (a), A horizon (b) and B horizon (c) in the Abies fabri (Mast.) Craib forest on Mt. Gongga |
同一采样点矿质土层Bio-PS的季节变化趋势类似(图 5b和5c)。S2样点的Bio-PS基本小于其他样点,A层和B层最小值均出现在8月。S4样点的Bio-PS基本大于其他样点,A层和B层的最大值均出现在9月。
2.4 土壤生物有效磷时空变化的影响因素表 3列出了具有显著相关关系的系数,可以看出,O层Bio-PL和StockBio-PL与各土壤性质均无显著相关关系,Bio-PS与TP显著正相关,与土壤温度、磷酸酶活性显著负相关(P < 0.05)。A层Bio-PL分别与TC、TN显著正相关,与土壤pH、Alox显著负相关;Bio-PS与Po显著正相关,与土壤温度显著负相关(P < 0.05)。B层Bio-PL和StockBio-PL均与TP显著正相关,且两者均分别与土壤温度、Feox、Alox、TC、TN、Po、磷酸酶活性显著负相关;Bio-PS分别与TP、MBP显著正相关,与土壤含水量、Feox、TC、TN显著负相关(P < 0.05)。C层Bio-PL和StockBio-PL均与Po显著正相关;Bio-PS与Alox显著负相关(P < 0.05)。
|
|
表 3 贡嘎山东坡峨眉冷杉林土壤生物有效磷与土壤性质的Spearman相关系数 Table 3 Spearman's correlation coefficients between bioavailable P and soil properties in the Abies fabri (Mast.) Craib forest on Mt. Gongga |
土壤生物有效磷的主要来源为矿物风化、解吸过程(酸性土壤主要来自Fe和Al氧化物)和Po矿化[2, 4-5],其消耗过程主要包括生物同化和径流流失[8-9]。
风化过程与岩性、温度、降水、土壤发育和植被类型密切相关[2, 25]。本研究4个海拔梯度上岩性和植被类型差异较小,温度和降水是风化的主要影响因子。低海拔地区土壤温度高、湿度大(表 2),岩石风化程度较强[25],生物有效磷含量应更高。然而,这与我们的实测结果相反(图 3和图 4)。酸性土壤中Fe和Al氧化物对生物有效磷的吸附是导致生物有效磷含量降低的主要地球化学过程[5]。但本研究中,一方面生物有效磷主要储存于O层(图 3),且O层中Bio-PL、StockBio-PL和Bio-PS均与Feox、Alox浓度无显著相关关系(P > 0.05);另一方面矿质土层中除B层外,A层和C层生物有效磷与Feox、Alox浓度的相关性均较弱(表 3)。因此,由Feox和Alox的吸附造成生物有效磷梯度特征改变的可能较小。土壤Po矿化是生物有效磷的主要来源[3-4],随海拔升高,温度和土壤含水量降低,微生物活性减弱(表 2),Po的矿化速率减慢[6-7],生物有效磷含量应逐渐降低。Po储量确实出现随海拔升高而增大的趋势(依次为1 021、825、1 125和1 296 kg·hm-2),但此时生物有效磷含量也随海拔升高而增加(图 3和图 4),且与土壤温度、磷酸酶活性均显著负相关(P < 0.05)(表 3)。植物的同化吸收是影响生物有效磷梯度变化的又一因素[9],但研究发现随海拔升高,植物对P的年需求量有增大趋势(表 1)。
因此,造成生物有效磷随海拔升高而增大这一分布特征的主要原因可能是低海拔地区生物有效磷流失量较大。此结论由以下证据支持:首先,对贡嘎山东坡亚高山土壤的多个研究已发现了较为明显的淋溶过程[12, 26],该过程造成了土壤溶质快速、大量运移[27-28]。其次,在本研究S2样点所处小流域的研究发现,该区域P由陆地向水体迁移的主要形态为树脂提取态P[29]。第三,本研究中低海拔地区相对较高的土壤含水量(表 2)进一步说明土壤淋溶作用是生物有效磷大量流失的重要原因之一。S2样点2016年6月各层Bio-PS均低于其他样点(图 4),表明在更酸、更湿的S2样点生物有效磷的流失量更大[8]。
3.2 土壤生物有效磷土层变化特征及影响因素总体而言,StockBio-PL远大于植物P年需求量(图 3b,表 1),这一结果与多个研究一致[30-31]。土壤中Bio-PL主要储存于O层(图 3b)且全年O层Bio-PS均大于0 mg·kg-1·d-1(图 5a),说明土壤有机质层有潜力全年为植物和微生物提供充足的生物有效磷[30]。然而,矿质土层较低的Bio-PL含量(图 3)和Bio-PS负值的出现(图 4、图 5b和5c),表明某些月份矿质土层的生物有效磷供给能力较差。
表层土壤生物有效磷含量显著高于底层的分布模式,从一定程度上展现了植物和微生物对生物有效磷垂直分层的控制作用[29]。植物吸收各层土壤中的生物有效磷,并通过凋落物将Po归还至土壤表层,因此表层Po矿化后释放的生物有效磷较下层土壤的生物有效磷浓度更高。与矿质层相比,O层中较高的TP和Po含量(图 2)和较强的磷酸酶活性(表 2)是造成土壤生物有效磷主要蓄积于O层的重要因素。
3.3 土壤生物有效磷季节变化特征及影响因素同一土层不同样点的Bio-PS季节变化存在一定差异(图 5a)。由高海拔至低海拔,有机质层Bio-PS季节变化依次出现S4和S3样点的“双峰型”(6月和9月)、S2样点的“单峰型”(9月)和S1样点的“无峰型”。S4和S3样点在6月也出现“峰值”是因为此时低海拔植物已进入生长季,开始吸收土壤中的生物有效磷,而高海拔较低的温度(表 2)使得植物和微生物活性较差[16],大量生物有效磷仍储存于土壤中。与8月相比,9月温度和降雨量分别下降25%和26%[15],生物有效磷被生物吸收量和随径流流失量减少。因此,9月是O层土壤P的生物有效性最高的月份,S2、S3和S4样点Bio-PS均在此时出现“峰值”。
S2样点有机质层Bio-PS的均值在绝大多数月份(除9-10月外)均为0 mg·kg-1·d-1(图 5a)。此外,该样点A层和B层的Bio-PS全年均为负值且低于其他样点(图 5b,图 5c),表明该样点全年P的生物有效性均较低[11]。为保证S2样点生物有效磷的充足供给,生态系统一方面通过MBP直接补偿(表 2);另一方面,通过提高磷酸酶活性矿化土壤Po以补偿有效磷库(表 2)。在生态系统补偿机制下S2样点O层中的生物有效磷输入量(岩石风化、Po矿化和矿物解吸等)基本等于其消耗量(生物吸收、矿物吸附和随径流流失等)[14]。
相较于有机质层,矿质土层Bio-PS季节变化的梯度差异较小,各样点A层和B层Bio-PS均在8月最小且为负值(图 5b,图 5c)。此时,贡嘎山东坡气温最高且降雨量最大(分别为12℃和310 mm)[15],处于旺盛生长期的生物对生物有效磷的大量吸收及强降雨导致生物有效磷的大量流失可能是造成此时矿质土壤生物有效磷含量较低的主要原因。
4 结论随海拔升高,贡嘎山东坡亚高山土壤生物有效磷含量有增大趋势,形成这一梯度特征的主要原因是低海拔地区生物有效磷随径流大量流失。9月是有机质层P的生物有效性最高的月份,8月是矿质土壤P的生物有效性最低的月份,生物吸收及随径流流失是控制生物有效磷季节变化的主要因素。
| [1] |
Mage S M, Porder S. Parent material and topography determine soil phosphorus status in the Luquillo Mountains of Puerto Rico . Ecosystems, 2013, 16(2): 284-294. DOI:10.1007/s10021-012-9612-5
(  0) 0) |
| [2] |
Walker T W, Syers J K. The fate of phosphorus during pedogenesis . Geoderma, 1976, 15(1): 1-19. DOI:10.1016/0016-7061(76)90066-5
(  0) 0) |
| [3] |
Vincent A G, Sundqvist M K, Wardle D A, et al. Bioavailable soil phosphorus decreases with increasing elevation in a subarctic tundra landscape. PLoS ONE, 2014, DOI: 10.1371/journal.pone.0092942
(  0) 0) |
| [4] |
De Feudis M, Cardelli V, Massaccesi L, et al. Effect of beech(fagus sylvatica L.)rhizosphere on phosphorous availability in soils at different altitudes(Central Italy) . Geoderma, 2016, 276: 53-63. DOI:10.1016/j.geoderma.2016.04.028
(  0) 0) |
| [5] |
Vincent A G, Schleucher J, Gröbner G, et al. Changes in organic phosphorus composition in boreal forest humus soils:The role of iron and aluminium . Biogeochemistry, 2012, 108(1/3): 485-499.
(  0) 0) |
| [6] |
Sundqvist M K, Wardle D A, Vincent A, et al. Contrasting nitrogen and phosphorus dynamics across an elevational gradient for subarctic tundra heath and meadow vegetation . Plant and Soil, 2014, 383(1/2): 387-399.
(  0) 0) |
| [7] |
Vitousek P M, Matson P A, Turner D R. Elevational and age gradients in Hawaiian montane rainforest:foliar and soil nutrients . Oecologia, 1988, 77(4): 565-570. DOI:10.1007/BF00377275
(  0) 0) |
| [8] |
Mukai M, Aiba S, Kitayama K. Soil-nutrient availability and the nutrient-use efficiencies of forests along an altitudinal gradient on Yakushima Island, Japan . Ecological Research, 2016, 31(5): 719-730. DOI:10.1007/s11284-016-1381-8
(  0) 0) |
| [9] |
Unger M, Leuschner C, Homeier J. Variability of indices of macronutrient availability in soils at different spatial scales along an elevation transect in tropical moist forests(NE Ecuador) . Plant and Soil, 2010, 336(1-2): 443-458. DOI:10.1007/s11104-010-0494-z
(  0) 0) |
| [10] |
Zhou J, Wu Y H, Bing H J, et al. Variations in soil phosphorus biogeochemistry across six vegetation types along an altitudinal gradient in SW China . Catena, 2016, 142: 102-111. DOI:10.1016/j.catena.2016.03.004
(  0) 0) |
| [11] |
Bing H, Wu Y, Zhou J, et al. Stoichiometric variation of carbon, nitrogen, and phosphorus in soils and its implication for nutrient limitation in alpine ecosystem of Eastern Tibetan Plateau . Journal of Soils and Sediments, 2016, 16(2): 405-416. DOI:10.1007/s11368-015-1200-9
(  0) 0) |
| [12] |
余大富. 贡嘎山的土壤及其垂直地带性. 土壤通报, 1984, 15(2): 65-68. Yu D F. Vertical zonal characteristics of soil in Gongga Mountain (In Chinese). Chinese Journal of Soil Science, 1984, 15(2): 65-68. (  0) 0) |
| [13] |
Bowman R A, Cole C V. An exploratory method for fractionation of organic phosphorus from grassland soils . Soil Science, 1978, 125(2): 95-101. DOI:10.1097/00010694-197802000-00006
(  0) 0) |
| [14] |
Bowman W D, Bahn L, Damm M. Alpine landscape variation in foliar nitrogen and phosphorus concentrations and the relation to soil nitrogen and phosphorus availability . Arctic, Antarctic, and Alpine Research, 2003, 35(2): 144-149. DOI:10.1657/1523-0430(2003)035[0144:ALVIFN]2.0.CO;2
(  0) 0) |
| [15] |
Wu Y, Li W, Zhou J, et al. Temperature and precipitation variations at two meteorological stations on eastern slope of Gongga Mountain, SW China in the past two decades . Journal of Mountain Science, 2013, 10(3): 370-377. DOI:10.1007/s11629-013-2328-y
(  0) 0) |
| [16] |
彭亮, 彭尽晖, 孙守琴, 等. 贡嘎山生态系统土壤呼吸带谱特征. 山地学报, 2015, 33(6): 696-702. Peng L, Peng J H, Sun S Q, et al. Characteristics of mountain ecosystem soil respiration along an elevation gradient on Gongga Mountain (In Chinese). Mountain Research, 2015, 33(6): 696-702. (  0) 0) |
| [17] |
Maynard D G, Curran M P. Soil density measurement in forest soils//Cartery M R, Gregorich E G. Soil sampling and methods of analysis. 2nd ed. Boca Raton: CRC Press, 2006
(  0) 0) |
| [18] |
罗辑, 杨忠, 杨清伟. 贡嘎山森林生物量和生产力的研究. 植物生态学报, 2000, 24(2): 191-196. Luo J, Yang Z, Yang Q W. A study of the biomass and production of forest on the Gongga Mountain (In Chinese). Acta Phytoecologica Sinica, 2000, 24(2): 191-196. DOI:10.3321/j.issn:1005-264X.2000.02.012 (  0) 0) |
| [19] |
罗辑, 程根伟, 李伟, 等. 贡嘎山天然林营养元素生物循环特征. 北京林业大学学报, 2005, 27(2): 13-17. Luo J, Cheng G W, Li W, et al. Characteristics of nutrient biocycling of natural forests on the Gongga Mountain (In Chinese). Journal of Beijing Forestry University, 2005, 27(2): 13-17. DOI:10.3321/j.issn:1000-1522.2005.02.003 (  0) 0) |
| [20] |
Courchesne F, Turmel M C. Extractable Al, Fe, Mn, and Si//Cartery M R, Gregorich E G. Soil sampling and methods of analysis. 2nd ed. Boca Raton: CRC Press, 2006
(  0) 0) |
| [21] |
Murphy J, Riley J P. A modified single solution method for the determination of phosphate in natural waters . Analytica Chimica Acta, 1962, 27: 31-36. DOI:10.1016/S0003-2670(00)88444-5
(  0) 0) |
| [22] |
Brookes P C, Powlson D S, Jenkinson D S. Measurement of microbial biomass phosphorus in soil . Soil Biology & Biochemistry, 1982, 14(4): 319-329.
(  0) 0) |
| [23] |
Tabatabai M. Soil enzymes//Hart S C, Stark J M, Davidson E A, et al. Methods of soil analysis. Part 2: Microbiological and biochemical properties. Madison: Soil Science Society of America, 1994
(  0) 0) |
| [24] |
Turner B L, Haygarth P M. Changes in bicarbonate-extractable inorganic and organic phosphorus by drying pasture soils . Soil Science Society of America Journal, 2003, 67(1): 344-350. DOI:10.2136/sssaj2003.3440
(  0) 0) |
| [25] |
Zhou J, Bing H, Wu Y, et al. Rapid weathering processes of a 120-year-old chronosequence in the Hailuogou Glacier foreland, Mt. Gongga, SW China . Geoderma, 2016, 267: 78-91. DOI:10.1016/j.geoderma.2015.12.024
(  0) 0) |
| [26] |
王良健. 贡嘎山东坡森林土壤类型发生学基本特征的研究. 西南师范大学学报(自然科学版), 1991, 16(1): 117-125. Wang L J. Study on the types genesis features of the forest soils on the east slope of Gongga Mountain (In Chinese). Journal of Southwest China Normal University(Natural Science Edition), 1991, 16(1): 117-125. (  0) 0) |
| [27] |
梁建宏, 吴艳宏, 周俊, 等. 土壤类型对优先流路径和磷形态影响的定量评价. 农业机械学报, 2017, 48(1): 220-227. Liang J H, Wu Y H, Zhou J, et al. Quantitative evaluation of effect of soil types on preferential flow pathways and soil phosphorus forms (In Chinese). Transactions of the Chinese Society for Agricultural Machinery, 2017, 48(1): 220-227. (  0) 0) |
| [28] |
牛健植, 余新晓, 张志强. 贡嘎山暗针叶林生态系统溶质优先运移分析. 北京林业大学学报, 2009, 31(5): 48-53. Niu J Z, Yu X X, Zhang Z Q. Solute preferential transport analysis of dark coniferous forest ecosystem of Gongga Mountain, Sichuan Province of southwestern China (In Chinese). Journal of Beijing Forestry University, 2009, 31(5): 48-53. DOI:10.3321/j.issn:1000-1522.2009.05.009 (  0) 0) |
| [29] |
吴艳宏, 周俊, 邴海健. 贡嘎山冷杉林带草海子小流域土壤及湖泊沉积物中磷的形态及迁移特征. 地球环境学报, 2013, 4(1): 1208-1214. Wu Y H, Zhou J, Bing H J. Soil and lake sediment phosphors fraction and migrating in a small Abis forest watershed, Gongga Mountain, Southwest China (In Chinese). Journal of Earth Environment, 2013, 4(1): 1208-1214. (  0) 0) |
| [30] |
Johnson A H, Frizano J, Vann D R. Biogeochemical implications of labile phosphorus in forest soils determined by the Hedley fractionation procedure . Oecologia, 2003, 135(4): 487-499. DOI:10.1007/s00442-002-1164-5
(  0) 0) |
| [31] |
Yang X, Post W M. Phosphorus transformations as a function of pedogenesis:A synthesis of soil phosphorus data using Hedley fractionation method . Biogeosciences, 2011, 8(10): 2907-2916. DOI:10.5194/bg-8-2907-2011
(  0) 0) |
2. University of Chinese Academy of Sciences, Beijing 100049, China
 2018, Vol. 55


