2. 中国国家博物馆,北京 100006
夯土齐长城由泥土夯筑而成,土壤水分对夯土结构具有重要影响,土壤含水率过高会造成夯土稳定性降低,进而引起墙体局部坍塌等问题[1-4]。因此,对夯土齐长城进行土壤含水率估测研究,对齐长城遗址的保护具有重要意义。传统的称重法、中子法和张力计法等土壤含水率测定方法,虽然精度较高,但工作量大、耗费时间长,要求条件较为苛刻[5-7]。高光谱技术具有数据信息丰富、高效无损等特点,弥补了传统测定方法上的不足。近年来国内外学者将其广泛应用于土壤理化性质估测研究中,因此,它已经逐渐成为高效获取土壤含水率的重要手段之一。
在利用高光谱数据估测土壤含水率的研究过程中,学者们发现土壤含水率光谱的响应波段是建立反演模型估算土壤含水率的关键[8-10]。已有研究表明,通过对土壤高光谱数据进行微分、对数、倒数、包络线去除等变换,可以增强光谱数据与土壤含水率之间的相关性,能有效地对比和筛选出敏感波段。刘伟东等[11]使用相对反射率法、一阶微分法、差分法等对土壤水分进行预测,结果发现反射率对数的一阶微分预测效果较好;尹业彪等[12]采用包络线且一阶微分法对土壤原始光谱反射率进行处理,提高了土壤含水率估测模型的预测精度;姚艳敏等[13]对土壤原始光谱反射率进行对数、倒数、一阶微分以及反射率倒数的一阶微分、对数的一阶微分变换,对比不同预处理后光谱反射率与土壤含水率之间的相关系数,发现对数的一阶微分变换后其相关系数最大;史舟等[14]采用多种方法对光谱数据进行预处理,通过对后期预测效果的比较发现SG平滑加一阶微分数据转换方法最佳;邓孺孺等[15-16]提出了土壤样品粒度对土壤反射率具有较大影响,申艳等[17]通过研究证明利用多元散射校正可以消除该影响。近年来,国内外学者发现多元散射校正方法可以消除样品粒度不同产生的散射影响,进而消除不同光谱之间的物理散射信息差异[18-19],但关于利用MSC方法校正过的光谱是否可以更加准确地进行波长优选的比较研究却很少。因此,本研究以夯土齐长城遗址土壤为研究对象,对原始反射率进行Lg(R)′和MSC +Lg(R)′两次预处理,进而对两次预处理之后的光谱数据和土壤含水率进行相关分析,对比两者之间的差异,筛选出土壤含水率的敏感波段。最终建立土壤含水率SVM估测模型,实现对齐长城土壤含水率的快速无损监测。
1 材料与方法 1.1 土壤样品采集研究区为青岛市黄岛区夯土齐长城遗址,其地理坐标为35°35′~36°08′N,119°30′~120°11′E,夯土齐长城由多种类型泥土夯筑而成。
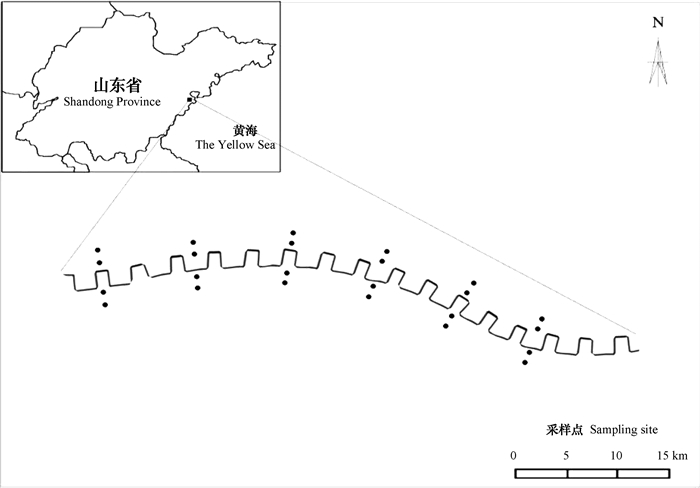
于2017年8月24-27日进行土样采集。首先,在齐长城中心线上每隔50 m选定一个点,然后,垂直于该点在齐长城遗迹两侧每隔20 m选定一个采样点,最终确定24个采样点,如图 1所示。每个样点取1 kg左右的新鲜土样装入采样袋中密封编号,每个采样点取两份样品。
|
图 1 夯土齐长城土壤样点分布图 Fig. 1 Soil sampling site Great Wall Dynasty Great Wall distribution map of the Qi Dynasty |
常规的光谱测量是先将土壤进行研磨、自然风干等一系列处理,然后设计不同含水量的土壤样品,这样的测量方法存在一些问题,土壤经过处理后破坏了土壤结构,并且最终建立的模型预测精度也存在较大的差异[20-21]。因此,为避免这些问题,本研究在采集土样的同时采用烘干法来获取原始土样的含水量。首先将干燥干净的铝盒称重,记为W1;然后将50 g左右土样置于铝盒中,盖后称重,记为W2,去盖放入烘箱中,105℃条件下烘至恒重;最后取出放干燥器冷却至恒温,立即称重,记为W3。计算公式为:
| $ 土壤含水率\left( \% \right)\frac{{{W_2} - W}}{{{W_3} - {W_1}}} = \times 100\% $ | (1) |
利用地物波谱仪对土壤样本进行光谱测定,测定仪器为美国ASD FieldSpec4便携式地物波谱仪,波谱仪波段范围为350~2 500 nm,350~1 000 nm波段范围内光谱采样间隔为1.4 nm,光谱分辨率为3 nm;1 000~2 500 nm波段范围内为2 nm,光谱分辨率为8 nm。重采样间隔为1 nm,输出波段数为2 151个。在一个能控制光照条件的暗室内,将土壤样本放于半径为5 cm、深为2 cm的器皿中,装满之后用直尺将土壤样本表面刮平。仪器的光源采用功率为50 W的卤素灯,光源距离土样中心30 cm。将光纤探头固定于三脚架上,探头的视场角为25°,距离土壤表面15 cm。测试之前先进行白板校正。测定时每个样品按90°旋转3次,每次采集5个土样光谱值,最后取20次平均值作为该土样的反射光谱数据。
1.4 光谱数据预处理为验证MSC对优选敏感波长的作用,采用Lg(R)′和MSC+Lg(R)′对原始光谱数据进行两次预处理。MSC算法如下:
| $ 平均光谱:\;\bar A = \frac{{\sum\nolimits_{i = 1}^n {{A_{i, j}}} }}{n} $ | (2) |
| $ 一元线性回归:{A_i} = {m_i}\bar A + {b_i} $ | (3) |
| $ 多元散射校正:{A_{i\left( {MSC} \right)}} = \frac{{\left( {{A_i} - {b_i}} \right)}}{{{m_i}}} $ | (4) |
式中,i = 1, 2,…,n;n为样本数;j表示第j个波长。
1.5 建模方法支持向量机算法最早是由Vladimir N.Vapnik和Alexey Ya.Chervonenkis在1963年提出,在90年代得到迅速发展和完善,目前的版本是Corinna Cortes和Vapnik在1995年发表。支持向量机的基本思想是求解能够正确划分训练数据集并且几何间隔最大的最佳超平面[22-23]。在解决小样本、非线性及高维模式识别问题中表现出许多特有的优势。通过多次训练进行参数优选,利用DPS数据处理软件确定该模型的参数,核函数类型为RBF,Gamma设置为2,其余各项均为默认值。
1.6 模型检验指标采用决定系数(R2)、相对误差(RE)、均方根误差(RMSE)和相对分析误差(RPD)对模型进行检验,以验证预测模型的精度。R2越大、RE和RMSE越小,表明模型估测精度越高;当1.5≤RPD < 2.0时表明模型只能对样品含量高低进行粗略估测,当2.0≤RPD < 2.5时表明模型具有较好的定量预测能力。
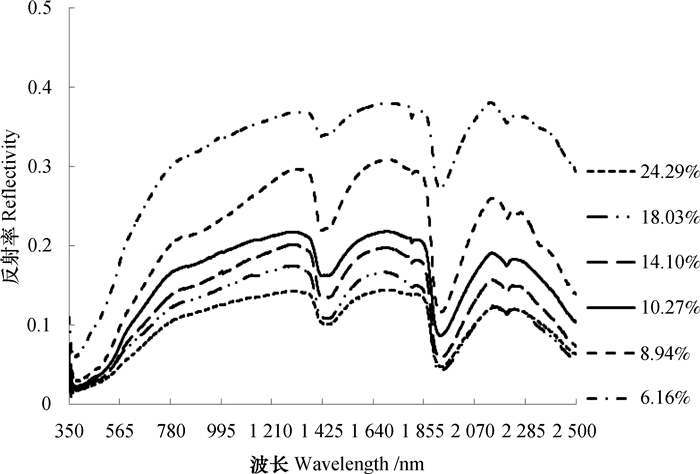
2 结果与讨论 2.1 不同含水率土壤的高光谱特征土壤是多种成分的复杂综合体,其高光谱反射率是由土壤组分及其结构的内在性质决定的[24-26]。为研究土壤含水率对土壤光谱特征的影响,分别选取含水率为6.16%、8.94%、10.27%、14.10%、18.03%、24.29%的土壤样本,其高光谱反射率曲线如图 2所示。由图 2可见,不同土壤含水率光谱曲线总体变化相似,但是随着含水率的增加,土壤高光谱反射率呈现逐渐下降趋势。对于具体波段而言,不同波段区间土壤含水率的响应特性也会不同。当土壤含水率较低时,随着土壤含水率的增加,短波红外波段反射率的变化幅度较大。
|
图 2 不同含水率的土壤光谱曲线 Fig. 2 Soil spectral curve relative to soil moisture content |
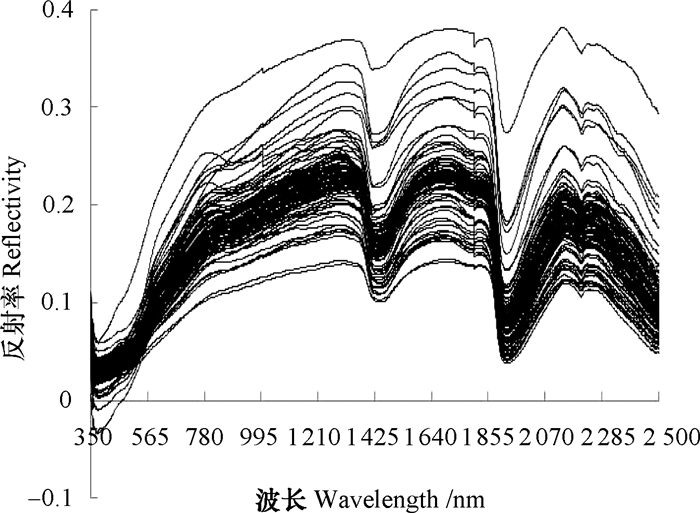
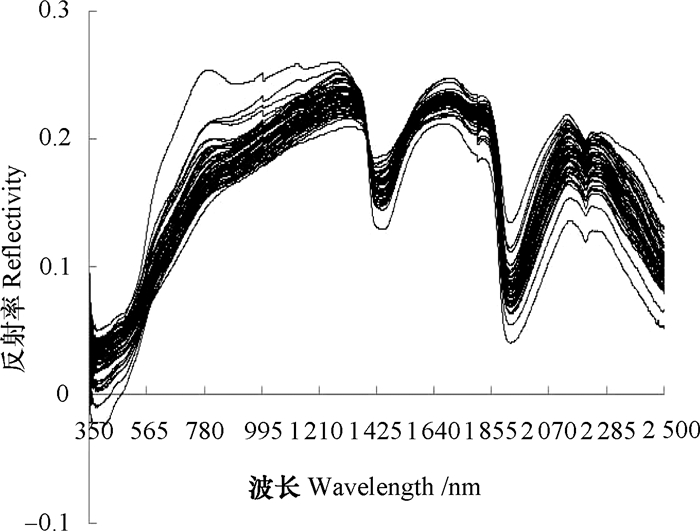
原始光谱曲线如图 3所示,各样本光谱反射率明显差异较大,光谱间存在基线平移、倾斜等现象,这可能是由土壤颗粒以及土壤样品装填密度不同产生的散射影响造成的[27-30]。多元散射校正处理后的光谱曲线如图 4所示,与原始光谱反射率相比,各样本光谱反射率差异显著减小,光谱更集中,光谱曲线特点更一致,这说明各样品的光谱偏移得到了一定的控制。如图 3和图 4所示,校正前后的光谱均保留了土壤样品的基本光谱特征,在393~790 nm曲线斜率较陡,790~1 350 nm曲线坡度较缓;在1 260 nm、1 686 nm以及2 125 nm附近具有明显的反射峰,在1 408 nm以及1 910 nm附近具有特征吸收带。
|
图 3 土壤原始光谱反射率 Fig. 3 Original spectral reflectance of the soil |
|
图 4 MSC预处理后土壤光谱反射率 Fig. 4 Soil spectral reflectance after MSC-pretreatment |
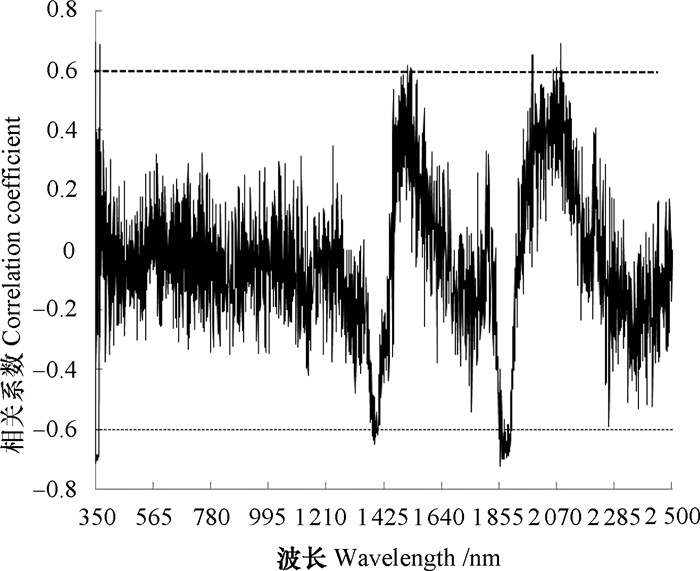
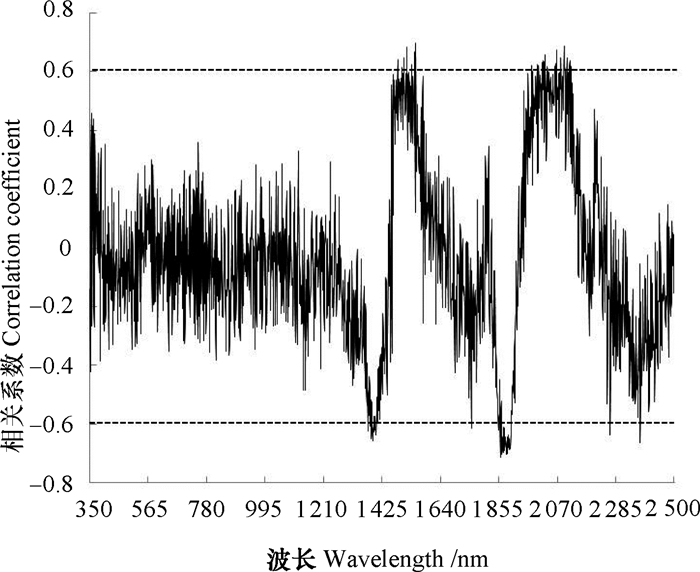
为研究MSC处理后的光谱是否可以更加准确地筛选敏感波长,分别对Lg(R)′和MSC+Lg(R)′处理后的光谱反射率与土壤含水率进行相关分析,如图 5和图 6。经对比可看出,经过MSC处理后,土壤光谱反射率与土壤含水率的相关性得到了明显增强。如图 6所示,1 450~1 500 nm、1 850~1 900 nm和2 050~2 100 nm波段范围内,土壤含水率与光谱反射率的相关性均达显著水平。如表 1所示,对原始光谱数据进行MSC+Lg(R)′处理得到7个相关性较高的波长,并且其相关系数明显提高,分别为-0.72、-0.71、0.7、-0.7、-0.69、-0.69、0.69;而对原始光谱数据进行对数一阶微分处理后,仅得到4个相关性较高的波长。因此,说明MSC可以对土壤光谱中的非化学信息进行校正,增强与土壤含水率相关的光谱吸收信息,有利于更加准确地选取敏感波长。最终选择1 861 nm、1 866 nm、1 549 nm、1 885 nm、1 871 nm、1 895 nm和2 095 nm作为土壤含水率的敏感波长。
|
图 5 Lg(R) ′光谱反射率与土壤含水率相关系数 Fig. 5 Correlation efficient between Lg(R)′spectral reflectance and soil moisture content |
|
图 6 MSC+ Lg(R) ′光谱反射率与土壤含水率相关系数 Fig. 6 Correlation efficient between MSC+Lg(R)′ spectral reflectance and soil moisture content |
|
|
表 1 土壤含水率与敏感波长的相关性 Table 1 Correlativity between soil moisture content and sensitive wavelength |
将本实验的48组数据按照含水率从小到大的顺序排列,按4:1的比例进行抽取,即每隔4个样本抽取1个样本,选取校正集36个,验证集12个。
为进一步探讨MSC处理是否能有效提取光谱信息中的微妙信号,更好地选取与土壤含水率有关的特征波段,分别利用Lg(R)′预处理后筛选出的波长和MSC+Lg(R)′预处理后筛选出的波长建立SVM回归模型,对比其模型精度。
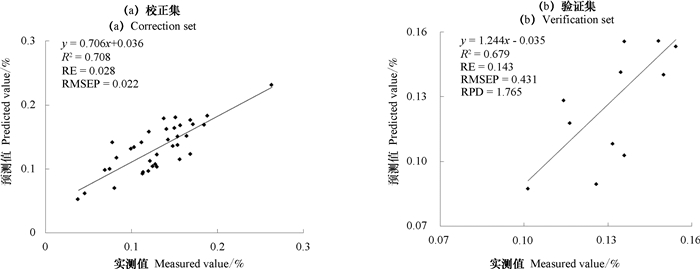
利用Lg(R)′预处理后筛选出的波长1 860 nm、1 872 nm、1 884 nm和2 083 nm建立SVM回归模型,模型对校正集和验证集的预测效果如图 7所示。
|
图 7 基于Lg(R)′预处理建立的SVM回归模型 Fig. 7 SVM regression model based on Lg(R)′pretreatment |
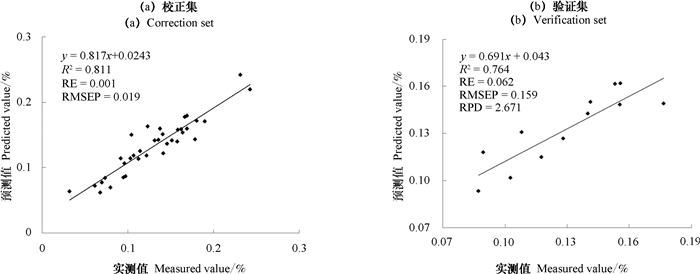
利用MSC+ Lg(R)′预处理后筛选出的敏感波长1 861 nm、1 866 nm、1 549 nm、1 885 nm、1 871 nm、1 895 nm和2 095 nm建立SVM回归模型,模型对校正集和验证集的预测效果如图 8所示,SVM回归模型的决定系数Rc2为0.811,RE为0.001,RMSEP为0.019;检验的决定系数Rv2为0.764,RE为0.062,RMSEP为0.159,RPD为2.671。
|
图 8 基于MSC+ Lg(R)′预处理建立的SVM回归模型 Fig. 8 SVM regression model based on MSC+Lg(R)′pretreatment |
根据图 7和图 8,对两个模型做对比分析,分别计算出决定系数(R2)、相对误差(RE)、均方根误差(RMSE)、相对分析误差(RPD),对模型进行检验,以验证预测模型的精度。如表 2所示。
|
|
表 2 SVM回归模型检验精度对比 Table 2 Comparative analysis of SVM regression models in prediction precision |
从表 2可以看出,基于不同预处理筛选出的敏感波段建立SVM回归模型,预测效果有所差异。利用Lg(R)′预处理后的数据建立的模型检验的决定系数Rv2为0.679,RE为0.143,RMSEP为0.431,RPD为1.765;而经过MSC处理后,建立的模型检验的决定系数Rv2为0.764,RE为0.062,RMSEP为0.159,RPD达到2.671,较Lg(R)′预处理后建立的模型预测效果更好,说明MSC方法校正过的光谱可以更加准确地建立土壤含水率估测模型。
3 结论经过Lg(R)′以及MSC+Lg(R)′处理后的夯土齐长城土壤光谱反射率的敏感波段主要集中在1 450~1 500 nm、1 850~1 900 nm和2 050~2 100 nm范围内,其中1 861 nm、1 866 nm、1 549 nm、1 885 nm、1 871 nm、1 895 nm和2 095 nm处与土壤含水率的相关系数最高。将土壤光谱数据进行MSC预处理,可以剔除各样品间由于散射影响造成的基线变化问题,更加准确地揭示土壤含水率与土壤光谱之间的相关性,提高敏感波长筛选的准确度。经对比发现,基于MSC+Lg(R)′预处理建立的SVM回归模型具有较高的精确度,其检验模型的RE为0.062,RMSEP为0.159,RPD为2.671,这进一步说明MSC处理可以增强光谱与土壤含水率相关的吸收信息,可更加准确地筛选敏感波长。
| [1] |
吴任平, 叶坤杰, 关瑞明. 南方传统生土建筑夯土墙的水稳定性及其加固保护技术. 华中建筑, 2016, 34(10): 59-62. Wu R P, Ye K J, Guan R M. Water stability and reinforcing protection techniques of alabaster walls in southern traditional soil construction (In Chinese). Huazhong Architecture, 2016, 34(10): 59-62. DOI:10.3969/j.issn.1003-739X.2016.10.013 (  0) 0) |
| [2] |
刘昭祎.长城与水的关系研究.北京: 北京建筑工程学院, 2012 Liu Z W. Research on the relationship between the Great Wall and water(In Chinese). Beijing: Beijing Institute of Civil Engineering and Architecture, 2012 (  0) 0) |
| [3] |
王旭东, 石玉成, 刘琨. 夯土长城墙体掏蚀失稳机理研究. 西北地震学报, 2011, 33(S1): 381-385. Wang X D, Shi Y C, Liu K. Research on sapping instability mechanism for rammed wall (In Chinese). Northwestern Seismological Journal, 2011, 33(S1): 381-385. (  0) 0) |
| [4] |
王宝卿.夯土建筑材料耐久性试验研究.西安: 西安建筑科技大学, 2006 Wang B Q. Experimental study on durability of bauxite building materials(In Chinese). Xi'an: Xi'an University of Architecture and Technology, 2006 (  0) 0) |
| [5] |
魏娜.土壤含水量高光谱遥感监测方法研究.中国农业科学院, 2009 Wei N. The study of applying hyper-spectral remote sensing technology in soil moisture monitoring(In Chinese). Beijing: Chinese Academy of Agricultural Sciences, 2009 (  0) 0) |
| [6] |
Chang C W, Laird D A. Near-infrared reflectance spectroscopic analysis of soil C and N . Soil Science, 2002, 167: 110-116. DOI:10.1097/00010694-200202000-00003
(  0) 0) |
| [7] |
Chris T, David R, Michael S, et al. Utility of remote sensing in predicting crop and soil characteristics . Precision Agriculture, 2003, 4: 359-384. DOI:10.1023/A:1026387830942
(  0) 0) |
| [8] |
金慧凝, 张新乐, 刘焕军, 等. 基于光谱吸收特征的土壤含水量预测模型研究. 土壤学报, 2016, 53(3): 627-635. Jin H N, Zhang X Y, Liu H J, et al. Study on prediction model of soil moisture content based on spectral absorption characteristics (In Chinese). Acta Pedologica Sinica, 2016, 53(3): 627-635. (  0) 0) |
| [9] |
孙越君, 郑小坡, 秦其明, 等. 不同质量含水量的土壤反射率光谱模拟模型. 光谱学与光谱分析, 2015, 35(8): 2236-2240. Sun Y J, Zheng X P, Qin Q M, et al. Simulation model of soil reflectance spectra with different mass and water content (In Chinese). Spectroscopy and Spectral Analysis, 2015, 35(8): 2236-2240. DOI:10.3964/j.issn.1000-0593(2015)08-2236-05 (  0) 0) |
| [10] |
刘秀英, 王力, 宋荣杰, 等. 黄绵土风干过程中土壤含水率的光谱预测. 农业机械学报, 2015, 46(4): 266-272. Liu X Y, Wang L, Song R J, et al. Loessial soil dry soil moisture content in the process of spectral prediction (In Chinese). Journal of Agricultural Machinery, 2015, 46(4): 266-272. (  0) 0) |
| [11] |
刘伟东, Frédéric Baret, 张兵, 等. 高光谱遥感土壤湿度信息提取研究. 土壤学报, 2004, 41(5): 700-706. Liu W D, Frédéric B, Zhang B, et al. Study on extraction of soil moisture information by hyperspectral remote sensing (In Chinese). Acta Pedologica Sinica, 2004, 41(5): 700-706. DOI:10.3321/j.issn:0564-3929.2004.05.006 (  0) 0) |
| [12] |
尹业彪, 李霞, 赵钊, 等. 沙质土壤含水率高光谱预测模型建立及分析. 遥感技术与应用, 2011, 26(3): 355-359. Yin Y B, Li X, Zhao Z, et al. Predict model and analysis of the sandy soil moisture with hyperspectral (In Chinese). Remote Sensing Technology and Application, 2011, 26(3): 355-359. (  0) 0) |
| [13] |
姚艳敏, 魏娜, 唐鹏钦, 等. 黑土土壤水分高光谱特征及反演模. 农业工程学报, 2011, 27(8): 95-100. Yao Y M, Wei N, Tang P Q, et al. Hyperspectral characteristics and inversion model of soil moisture in black soil (In Chinese). Transactions of the Chinese Society of Agricultural Engineering, 2011, 27(8): 95-100. DOI:10.3969/j.issn.1002-6819.2011.08.016 (  0) 0) |
| [14] |
史舟, 王乾龙, 彭杰, 等. 中国主要土壤高光谱反射特性分类与有机质光谱预测模型. 中国科学:地球科学, 2014, 44(5): 978-988. Shi Z, Wang Q L, Peng J, et al. Classification of main soil hyperspectral reflectance characteristics and organic spectral prediction model in China (In Chinese). Science in China:Earth Science, 2014, 44(5): 978-988. (  0) 0) |
| [15] |
邓孺孺, 田国良, 柳钦火. 基于多次散射的植被-土壤二向反射模型. 遥感学报, 2004, 8(3): 193-200. Deng R R, Tian G L, Liu Q H. Bi-directional reflectance model of canopy and soil based on multi-scatterings (In Chinese). Journal of Remote Sensing, 2004, 8(3): 193-200. (  0) 0) |
| [16] |
邓孺孺, 田国良, 柳钦火, 等. 粗糙地表土壤含水量遥感模型研究. 遥感学报, 2004, 8(1): 75-80. Deng R R, Tian G L, Liu Q H, et al. Research on remote sensing model for soil water on rough surface (In Chinese). Journal of Remote Sensing, 2004, 8(1): 75-80. (  0) 0) |
| [17] |
申艳, 张晓平, 杨学明, 等. 光谱预处理及不同光谱区对黑土有机碳近红外光谱模型的影响. 土壤学报, 2010, 47(5): 1005-1012. Shen Y, Zhang X P, Yang X M, et al. Effects of spectral pretreatment and different spectral regions on near infrared spectroscopy of organic carbon in black soil (In Chinese). Acta Pedologica Sinica, 2010, 47(5): 1005-1012. (  0) 0) |
| [18] |
Geladi P, Macdougall D, Martens H. Linearization and scatter correction for near infrared reflectance spectra of meat . Applied Spectroscopy, 1985, 39: 491-500. DOI:10.1366/0003702854248656
(  0) 0) |
| [19] |
Estienne F, Despagne F, Walczak B, et al. A comparison of multivariate calibration techniques applied to experimental NIR data sets . Chemometrics and Intelligent Laboratory Systems, 2004, 73: 207-218. DOI:10.1016/j.chemolab.2004.04.007
(  0) 0) |
| [20] |
吴代晖, 范闻捷, 崔要奎, 等. 高光谱遥感监测土壤含水量研究进展. 光谱学与光谱分析, 2010, 30(11): 3067-3071. Wu D H, Fan W J, Cui Y K, et al. Review of monitoring soil water content using hyperspectral remote sensing (In Chinese). Spectroscopy and Spectral Analysis, 2010, 30(11): 3067-3071. DOI:10.3964/j.issn.1000-0593(2010)11-3067-05 (  0) 0) |
| [21] |
陈雅涵, 谢宗强. 保存过程对土壤生化指标的影响及保存土样的应用. 土壤学报, 2018, 55(4): 783-796. Chen Y H, Xie Z Q. Effects of storage on soil biochemical properties and application of stored soil (In Chinese). Acta Pedologica Sinica, 2018, 55(4): 783-796. (  0) 0) |
| [22] |
梁礼明, 钟震, 陈召阳. 支持向量机核函数选择研究与仿真. 计算机工程与科学, 2015, 37(6): 1135-1141. Liang L M, Zhong Z, Chen Z Y. Support vector machine kernel function selection research and simulation (In Chinese). Computer Engineering and Science, 2015, 37(6): 1135-1141. DOI:10.3969/j.issn.1007-130X.2015.06.015 (  0) 0) |
| [23] |
汪海燕, 黎建辉, 杨风雷. 支持向量机理论及算法研究综述. 计算机应用研究, 2014, 31(5): 1281-1286. Wang H Y, Li J H, Yang F L. A survey of support vector machine theory and algorithm research (In Chinese). Computer Application Research, 2014, 31(5): 1281-1286. DOI:10.3969/j.issn.1001-3695.2014.05.001 (  0) 0) |
| [24] |
史舟. 土壤地面高光谱遥感原理与方法. 北京: 科学出版社, 2014. Shi Z. Principle and method of hyperspectral remote sensing of soil surface (In Chinese). Beijing: Science Press, 2014. (  0) 0) |
| [25] |
杨曦光, 于颖. 基于试验反射光谱数据的土壤含水率遥感反演. 农业工程学报, 2017, 33(22): 195-199. Yang X G, Yu Y. Inversion of soil moisture using remote sensing based on experimental reflectance spectroscopy data (In Chinese). Transactions of the Chinese Society of Agricultural Engineering, 2017, 33(22): 195-199. DOI:10.11975/j.issn.1002-6819.2017.22.025 (  0) 0) |
| [26] |
Pandey A, Srivatava A. Bistatic scatter meter monitoring of soil moisture by microwave remote sensing at X-band . Russian Agricultural Sciences, 2017, 43(5): 440-444.
(  0) 0) |
| [27] |
宋海燕, 程旭. 水分对土壤近红外光谱检测影响的二维相关光谱解析. 光谱学与光谱分析, 2014, 34(5): 1240-1243. Song H Y, Cheng X. Two-dimensional correlation spectroscopy analysis of the effects of soil water on NIR detection (In Chinese). Spectroscopy and Spectral Analysis, 2014, 34(5): 1240-1243. DOI:10.3964/j.issn.1000-0593(2014)05-1240-04 (  0) 0) |
| [28] |
刘秀英, 石兆勇, 常庆瑞, 等. 黄绵土钾含量高光谱估算模型研究. 土壤学报, 2018, 55(2): 325-337. Liu X Y, Shi Z Y, Chang Q R, et al. Hyperspectral model for estimation of soil potassium content in Loessal Soil (In Chinese). Acta Pedologica Sinica, 2018, 55(2): 325-337. (  0) 0) |
| [29] |
李萍, 赵庚星, 高明秀, 等. 黄河三角洲土壤含水量状况的高光谱估测与遥感反演. 土壤学报, 2015, 52(6): 1262-1272. Li P, Zhao G X, Gao M X, et al. Hyperspectral estimation and remote sensing inversion of soil water content in the Yellow River Delta (In Chinese). Acta Pedologica Sinica, 2015, 52(6): 1262-1272. (  0) 0) |
| [30] |
Qi H J, Paz-Kagan T, Karnieli A, et al. Evaluating calibration methods for predicting soil available nutrients using hyperspectral VNIR data . Soil and Tillage Research, 2018, 175: 267-275. DOI:10.1016/j.still.2017.09.006
(  0) 0) |
2. National Museum of China, Beijing 100006, China
 2018, Vol. 55


