2. 中国科学院大学, 北京 100049
2. University of Chinese Academy of Sciences, Beijing 100049, China
土壤微生物是土壤生态系统的重要组成部分, 对生物地球化学循环和成土过程等均起着重要的调节作用[1-3], 被认为是最具潜力反映土壤质量的敏感性指标之一[4-5]。受特定因素影响, 土壤微生物群落可呈现出相应的空间分布特征[6]。其中, 土壤细菌数量最大、种类繁多, 多样性大于任何其他生物群落[7]。因此, 研究土壤细菌多样性的空间变异性, 对制定合理高效的土壤野外调查采样方案[[8], 定量化研究人为作用下的土壤细菌及其参与的生物地球化学循环和成土过程等, 均具有重要意义。
土壤细菌空间变异性研究在多种尺度上均取得进展。Pasternak等[9]在干旱半干旱区0.5~100 km区域尺度上的研究表明, 地理距离显著影响土壤细菌群落分布, 但在1 cm~500 m尺度上的影响不显著。但也有研究指出, 在 < 10 km的区域尺度上, 土壤细菌物种的多样性、群落的丰富度在空间分布上的差异并不显著[10-12]。易祎[13]在东北黑土区对典型流域农田土壤的研究表明, 土壤细菌数量下游与上游和中游的差异显著, 坡中部与坡上部和下部的差异显著。周赛等[14]研究表明, 我国中亚热带(浙江、福建、江西、湖南)的毛竹林土壤细菌α多样性指数的地带性变化趋势不显著, 但群落相似度在670 km距离范围内随着采样点间距增大而降低。褚海燕等[15]通过分析地理空间距离与群落距离的相关性, 发现华北平原麦田的空间距离对土壤微生物空间分布有重要的作用。
土壤类型对土壤细菌多样性也具有显著影响。Grządziel和Gałązka[16]通过不同类型土壤在100多年相同管理条件下的微区试验研究, 证实了土壤类型与微生物丰度和多样性直接相关。Chen等[17]针对重庆、湖北和辽宁三个地区不同类型的水稻土, 通过10周不同处理的水稻盆栽实验发现土壤类型是影响氨氧化细菌丰度和群落结构的重要因素。但这些研究或是局限于小范围的试验站中、或是分散于广大的区域范围, 忽略了空间尺度带来的自然环境条件差异对于土壤细菌多样性影响;且涉及的土壤分类层次仅为高级分类单元——土类, 没有涉及较低级的土壤分类单元(如土壤亚类、土属、土种等)对土壤细菌多样性的影响。
样点空间距离[18-19]和土壤分类粒度[20-21]是衡量土壤调查精度和样点代表性的重要指标, 但目前两者对土壤微生物(如细菌)的综合影响作用并不清楚。因此, 本研究以稻-麦轮作农田为研究对象, 通过实地调查和采样, 利用16S rDNA基因测序分析技术, 研究土壤细菌多样性在不同土壤样点空间距离和土壤分类粒度上的变异性特征, 综合分析样点空间距离和土壤分类粒度对土壤细菌多样性的影响, 为农田土壤微生物研究及其调查样点合理布设提供理论依据。
1 材料与方法 1.1 研究区概况研究区为江苏省常熟市(31°33′~31°50′ N, 120°33′~121°3′ E), 位于长江三角洲地区前缘, 下辖虞山、琴川、莫城、常福3个街道, 支塘、古里、尚湖、辛庄、海虞、沙家浜、梅李、董浜9个镇以及高新区和碧溪新区, 全市总面积1301 km2[22]。该市属亚热带季风气候, 四季分明, 气候温和, 雨量充沛, 年均气温17.4 ℃, 降水量1 823 mm。除虞山、顾山、福山等山丘外, 地形以水网交织的冲积和湖积平原为主, 海拔在3~7 m。土壤类型以水稻土和潮土为主, 占全市耕地面积97%以上, 主要种植水稻、小麦和一些经济作物[23]。
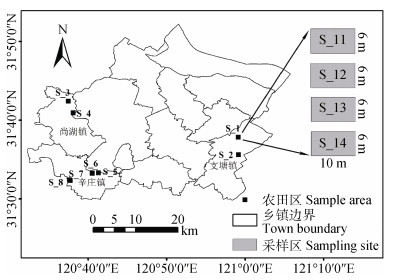
1.2 采样方案设计考虑不同土壤类型及其分类粒度(土类、亚类、土属、土种), 按村(< 10 km)、镇(10~20 km)、县域(> 20 km)3种空间尺度选择稻麦轮作的8个农田样区(S_1 - S_8), 并按田块尺度(< 50 m)在每个农田区设计4个6 m×10 m相邻采样区, 如S_1农田区设计S_11 - S_14四个采样区(图 1)。这8个农田区涉及研究区主要土壤类型, 涵盖2个土类, 3个亚类, 6个土属, 7个土种(表 1), 分布在尚湖、辛庄和支塘3个乡镇、6个村庄。其中尚湖与辛庄相邻, 位于市域西部, 而支塘镇位于市域东南角, 与上述两镇距离最远(表 2)。
|
注:其他农田区内采样区设计与S_1相同 Note:Designing of sampling sites in the other farmlands is the same as that in S_1 图 1 常熟研究区及稻麦轮作农田样区分布图 Fig. 1 Distribution map of the study area and sampling sites in Changshu City |
|
|
表 1 各农田样区土壤类型 Table 1 Soil types relative to sample area |
|
|
表 2 各农田样区相互空间距离 Table 2 Spacing of sample areas /km |
首先调查各样区农田管理信息, 如施肥量、小麦与水稻总产量及秸秆还田量等(表 3)。在2016年11月水稻收割后, 在各采样区按梅花状采集表层土壤混合样品, 共32个土壤样品。土样在剔除根系后, 一份低温密封贮运, 带回实验室-80 ℃保存, 用于土壤微生物分析;另一份在实验室风干后用于测定理化性质(表 4)。
|
|
表 3 研究区主要农田管理措施统计特征 Table 3 Statistic characteristics of farmland management measures in the study area |
|
|
表 4 研究区主要土壤理化性质统计特征 Table 4 Statistic characteristics of physico-chemical properties of the soils in the study area |
土壤微生物DNA提取使用MiSeq Reagent Kit v2试剂盒, 按试剂盒操作说明书提取;并采用琼脂糖凝胶电泳检测基因组DNA完整性, Nanodrop 2000检测基因组DNA质量。对土壤细菌16S rDNA基因V4-V5区进行PCR扩增, 扩增引物采用F(GTGCCAGCMGCCGCGG)和R(CCGTCAATTCM TTTRAGTTT)。PCR扩增程序:94 ℃ 2 min;94 ℃ 20 s, 55 ℃ 30 s, 72 ℃ 1 min, 25个循环;72 ℃延伸10 min。扩增后产物琼脂糖凝胶电泳检测, 应用核酸纯化磁珠纯化, 得到一个样本的原始文库。对文库定量、混合、质量检验后, 采用Miseq平台进行双端测序。
1.4 多样性指数计算α多样性(Chao1指数、Shannon指数和Simpson指数)表征环境群落内的物种丰度和多样性。其中, Chao1指数用于估计样品中所含OTU(Operational Taxonomic Unit)数目, 数值越大代表物种越多, 菌群丰度越大。Shannon指数(H)和Simpson指数(D)均用来估算样品中微生物的多样性指数:前者数值越大, 菌群多样性越高, 均一性越好;后者数值越大, 菌群多样性越低。它们的计算方法如下[24-26]:
| $Chao{\rm{1 = }}{{\rm{S}}_{{\rm{obs}}}} + \frac{{F_1^2}}{{2{F_2}}}$ | (1) |
式中,Sobs表示样本中观察到的物种数目;F1为样本中数量只为1的物种数目;F2为样本中数量只为2的物种数目。
| $H = - \sum\nolimits_{i = 1}^S {{P_i}} \times {\rm{In}}{P_i}$ | (2) |
式中,Pi为物种i的个体数目占总个体数的百分比;S为物种总数。
| $D = 1 - \sum\nolimits_{i = 1}^S {P_i^2} $ | (3) |
式中, Pi为物种i的个体数目占总个体数的百分比;S为物种总数。
β多样性表征沿环境梯度不同生境群落之间物种组成的相异性, 其指标Bray-Curtis相异度(DBray-Curtis)表示两个样本间微生物的群落组成差异, 数值越大, 差异越大。计算方法如下[27]:
| ${D_{Bray - Curtis}} = 1 - 2\frac{{\sum {\min ({S_{{\rm{A}}, i}}{S_{{\rm{B}}, i}})} }}{{\sum {{S_{{\rm{A}}, i}} + \sum {{S_{{\rm{B}}, i}}} } }}$ | (4) |
式中, SA, i和SB, i表示第i个OTU分别在A群落和B群落中的计数;min表示取两者最小值。
1.5 数据处理与分析对16S rDNA V4-V5检测区的原始序列数据进行质量过滤(去除末尾质量低于Q15的碱基, 通过重叠关系拼接成对序列, 去除短序列末尾的杂序列以及非特异性扩增片段, 根据碱基质量的累加值进行过滤), 剔除总碱基错误率高于2的序列后得到1 796 464个优化序列, 优化序列中Q30数据达到80%以上。使用UPARSE聚类方法将优化序列在相似性≥97%的水平上进行OTU聚类, 并利用RDP数据库[28]进行物种注释。应用mothur[29]软件计算土壤细菌α多样性(Chao1、Shannon和Simpson指数), 应用R软件vegan包进行β多样性分析(Bray-Curtis相异度)、层次聚类分析、SIMPER分析和Mantel分析[30]。
利用土壤细菌α多样性指数的变异系数CV与Bray-Curtis相异度评估3种不同类型尺度下土壤细菌群落的变异性特征。分别为:(1)空间距离尺度, 分别为田块尺度(< 50 m)、乡村尺度(< 10 km)、乡镇尺度(10~20 km)、县域尺度(> 20 km)4种空间距离尺度;(2)土壤分类粒度, 分别为土类、亚类、土属、土种4种土壤分类粒度;(3)空间距离-土壤分类的综合尺度, 在空间距离尺度上进一步按土类、亚类、土属进行分组。利用Microsoft Excel 2016统计分析不同尺度下土壤细菌多样性指数的变异系数, 利用IBM Statistics SPSS 22.0对不同尺度的多样性进行差异显著性分析(LSD法, α=0.05)和哑元相关分析, 并采用Origin8.5软件制作相应图件。
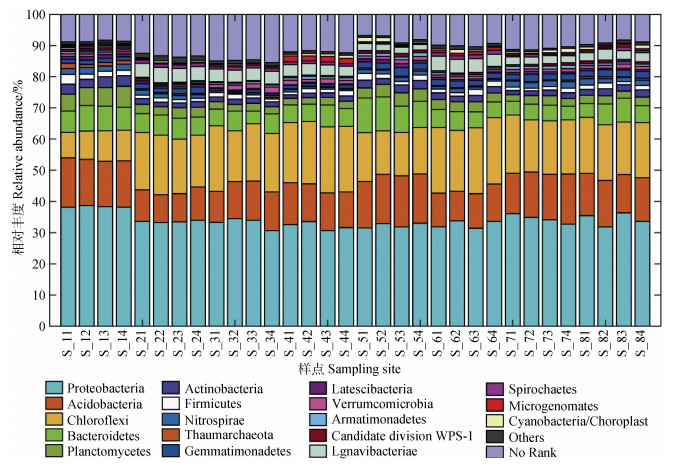
2 结果与讨论 2.1 研究区土壤细菌多样性总体特征研究区所有样点土壤细菌α多样性指数的变异系数统计特征(表 5)表明, Shannon指数[31]、Chao1指数和Simpson指数属于中等强度变异。土壤细菌群落组成分析结果(图 2)显示, 在细菌门水平分类下, 各样点主要优势菌群有变形菌门(Proteobacteria)、酸杆菌门(Acidobacteria)、绿弯菌门(Chloroflexi)与拟杆菌门(Bacteroidetes), 但优势群落相对丰度的占比存在差异。SIMPER分析结果表明, 变形菌门(Proteobacteria)、酸杆菌门(Acidobacteria)、绿弯菌门(Chloroflexi)与拟杆菌门(Bacteroidetes)共同提供了40%~60%群落结构差异的解释度。
|
|
表 5 研究区样点土壤细菌α多样性指数统计特征 Table 5 Statistic characteristics of α diversity index of soil bacteria in the study area |
|
图 2 研究区样点土壤细菌群落结构分析 Fig. 2 Soil bacterial community structure relative to sampling site |
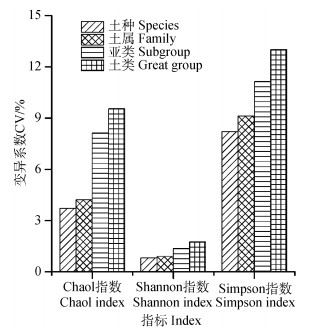
各土壤分类粒度下土壤细菌α多样性指数的平均变异系数计算(图 3)表明, 土壤分类时三种多样性指数的变异系数较未分类时均降低。其中, Chao1指数变异系数在土类、亚类、土属和土种分类粒度上分别降低了1.22%、2.64%、6.55%和7.05%, Shannon指数变异系数分别降低了1.32%、1.71%、2.18%和2.26%, Simpson指数变异系数分别降低了9.25%、11.12%、13.13%和14.05%, 各土壤分类粒度的多样性指数变异系数几乎均小于10%。随着土壤分类粒度的减小, 三种多样性指数的变异系数均有减小趋势。土壤分类使土壤细菌α多样性的变异性降低, 并随着土壤分类粒度的减小, 这种变异性越来越小, 表明按土壤分类进行布点采样, 土壤细菌α多样性分析数据更具代表性, 分类粒度越小, 代表性越强。
|
图 3 土壤细菌α多样性指数在不同土壤分类粒度下的平均变异系数 Fig. 3 Mean CVs of α diversity index of soil bacteria relative to soil classification granularity |
从β多样性来看, Bray-Curtis相异度(群落相异度)由高到低依次为不同土类(两个样本为不同土类)、土类、亚类、土属和土种。不同土类分组、土类分组与其他分组差异均达到显著水平, 但土种分组、土属分组和亚类分组之间差异不显著(图 4)。表明随着土壤分类粒度的减小, 土壤细菌群落相异度有降低趋势。土壤分类后采样使样点数据更具代表性, 若分别按土种和土类分类粒度进行布点采样, 土种粒度采样模式的土壤β多样性分析数据较土类粒度采样模式代表性更强。

|
注:不同小写字母表示差异显著(P < 0.05).下同 Note:Different Lowercase letters indicate significant differences(P < 0.05). The same below 图 4 土壤细菌群落在不同土壤分类粒度下的Bray-Curtis相异度 Fig. 4 Bray-Curtis dissimilarity of soil bacterial communities relative to soil classification granularity |
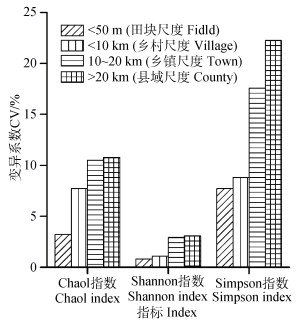
不同空间距离尺度下土壤细菌α多样性指数的变异系数计算结果(图 5)显示, 三种多样性指数的变异系数均呈现出随样点空间距离增加而提升的变化特征, Chao1指数、Shannon指数和Simpson指数的变异系数变化范围分别为3.32%~10.77%、0.81%~3.08%和7.71%~22.26%。Chao1指数和Shannon指数的变异系数在设定的所有空间距离尺度下几乎均小于10%, Simpson指数变异系数在田块(< 50 m)和乡村(< 10 km)尺度下小于10%, 乡镇(10~20 km)和县域(> 20 km)尺度下大于10%。三种多样性指数的变异系数在乡镇尺度(10~20 km)下较乡村尺度(< 10 km)增加最为显著, 表明在此区域范围内土壤样点空间距离或样点密度对农田土壤细菌多样性分析将具有显著性影响。对细菌群落Bray-Curtis相异度的分析也具有同样特点。
|
图 5 土壤细菌α多样性指数在不同空间距离尺度下的平均变异系数 Fig. 5 Mean CVs of α diversity index of soil bacteria relative to sampling site spacing |
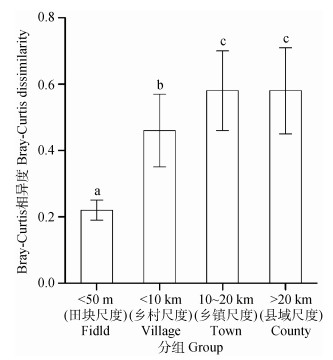
不同空间距离尺度下土壤细菌群落的Bray-Curtis相异度显示(图 6), 细菌群落相异度也呈现出随样点空间距离的增加而增大的变化规律, 除乡镇(10~20 km)与县域(> 20 km)尺度之间无显著差异, 其他空间距离尺度之间差异显著。田块尺度(< 50 m)下群落相异度最小, 同一田块内土壤细菌群落组成大致相同。群落相异度在县域尺度(> 20 km)未有明显增加, 说明随着空间距离尺度的扩大, 土壤细菌群落结构的差异增大, 而且在一定距离之后, 差异增加减缓。
|
图 6 土壤细菌在不同空间距离尺度下的Bray-Curtis相异度 Fig. 6 Bray-Curtis dissimilarity of soil bacterial communities relative to sampling site spacing |
因在 < 50 m范围内为相同土种, > 20 km无相同土类土壤, 将土壤样本在乡村尺度(< 10 km)和乡镇尺度(10~20 km)空间距离分类的基础上, 各自按不同土壤分类粒度进行分组, 得到两者综合尺度下的α多样性指数的变异系数和样本间的Bray-Curtis相异度(表 6)。两种尺度的共同作用下, 土壤细菌α多样性指数的变异系数和细菌群落相异度较单一尺度均有所降低。乡镇尺度(10~20 km)下样点土壤分类后的α多样性指数变异系数较乡村尺度(< 10 km)的减少为更明显, 表明在样区达到一定空间距离时, 考虑土壤分类粒度的样点布设方案可显著提升样点代表性。
|
|
表 6 土壤细菌在空间距离-土壤分类综合尺度下的多样性指标变异系数与Bray-Curtis相异度 Table 6 CVs of soil bacterial α diversity index and Bray-Curtis dissimilarity relative to spacing-classification granularity combination |
在不同空间距离尺度下土壤分类粒度对土壤细菌群落相异度的影响也不同。在乡村(< 10 km)尺度下, 细菌群落相异度随土壤分类粒度的变化有限, 在乡镇(10~20 km)尺度下, 群落相异度随着土壤分类粒度细化而减小。表明在乡镇尺度研究土壤细菌多样性, 调查样点布设不仅需关注土壤分类粒度, 而且需选择合适的土壤分类粒度, 对提升土壤样点代表性和调查精度更为有效。
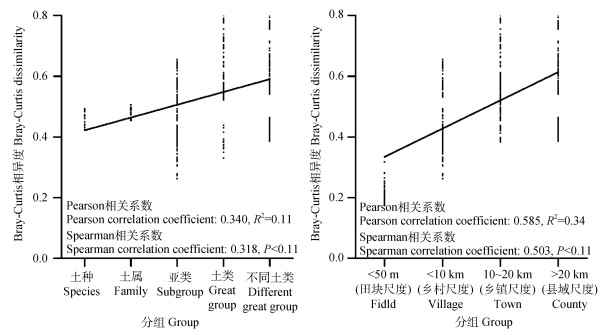
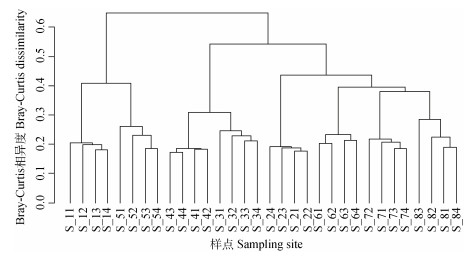
3 讨论 3.1 土壤细菌群落相异度与土壤分类粒度和空间距离尺度关系比较上述结果表明土壤分类粒度与空间距离尺度均对土壤细菌群落相异度有影响(图 4、图 6)。两者与土壤细菌群落相异度的哑元相关分析结果(图 7)显示, 空间距离尺度与细菌群落相异度的Spearman等级相关系数和Pearson相关系数, 均远高于土壤分类粒度, 表明样点空间距离尺度与细菌群落结构差异的相关性较土壤分类粒度更强。利用Bray-Curtis距离矩阵进行层次聚类分析也可直观看出, 研究区样本间土壤细菌群落结构相似度与空间距离相关, 但因土壤分类的聚集分布并不明显(图 8)。因此, 在农田土壤微生物调查研究中采样布设方案更多地关注土壤样点空间距离尺度变化对土壤微生物分析的影响作用。
|
图 7 土壤细菌群落相异度与土壤分类粒度和空间距离尺度的关系 Fig. 7 Relationships between soil bacterial community dissimilarity and soil classification granularity and sampling site spacing |
|
图 8 研究区土壤细菌群落相似度树状图 Fig. 8 Soil bacterial community similarity tree in the study area |
土壤细菌对于土壤环境的改变是灵敏和显著的, 土壤pH[32]、土壤质地和有机质等营养元素[33]等均对土壤细菌产生影响。土壤理化性质在不同空间距离尺度的差异, 是空间距离尺度影响土壤细菌群落结构特征重要因素。黄晶晶[34]、王秀虹等[35-36]在县域幅度范围内研究表明, 土壤pH、土壤质地(黏粒、粉粒、砂粒)和有机质等属性的空间变异性, 在一定区域幅度范围内, 均随着样区幅度扩大而急速增加, 研究区土壤理化性质随着样区空间距离的扩展, 空间变异性增强, 并且大于随土壤分类粒度的变化(表 7)。
|
|
表 7 主要土壤理化性质在不同尺度下的变异系数 Table 7 CVs of main soil physico-chemical properties relative to scale in the study area/% |
土壤pH被认为是土壤细菌群落结构的重要预测因子[32], Mantel分析也表明pH与土壤细菌结构的相关性最强(表 8)。群落相异度在乡镇尺度随样点空间距离增大, 但在县域尺度增加微弱, 原因可能在于pH的变异系数在达到县域尺度(> 20 km)后增加变缓(表 7), 使得细菌群落结构差异不再扩大。而pH在土壤分类粒度上变异系数小, 且变化不大, 未能体现细菌群落相异度随土壤分类粒度的变化特征。因此, 农田土壤理化性质尺度变化对土壤细菌群落结构特征的影响, 是空间距离尺度对细菌多样性影响的重要体现。
|
|
表 8 土壤理化性质与农田管理措施与土壤细菌群落结构的相关性 Table 8 Relationship of soil bacterial community structure with soil physico-chemical properties and farmland management measures in the study area |
农田管理措施不仅可以影响土壤性质, 也是影响土壤细菌多样性的重要因子[37-40]。图 8中尚湖镇的3号农田区与4号农田区, 辛庄镇的6号、7号与8号农田区分别聚集分布, 这可能由于当样点空间距离达到一定尺度, 人类活动按村、镇等聚集分布, 农田管理措施发生了变化。Mantel分析表明氮肥量、磷肥量、总产量与土壤细菌结构显著相关(表 8), 而这些管理措施在乡村尺度下(< 10 km)最为一致(表 9), 这可能与当地农技指导随地域变化有关。但管理措施变异特征在土壤分类粒度上无明显规律, 甚至出现随着分类粒度减小, 管理措施差异变大的现象, 这可能是由于人为因素干扰了土壤分类粒度的尺度效应, 相同土属农田因不同地域农户的管理而差异较大, 相同土类农田因一户多田管理或按地域分布集中, 差异反而较小。因此, 农田管理措施的地域性差异, 是空间距离尺度影响土壤细菌群落结构特征重要因素。
|
|
表 9 研究区主要农田管理措施在不同尺度下的变异系数 Table 9 CVs of farmland management measures relative to scale /% |
常熟市稻麦轮作农田土壤细菌α多样性指数中Chao1指数与Shannon指数变异系数总体较低, Simpson指数为中等变异性, 随着土壤分类粒度和样点空间距离的减小而降低。土壤细菌群落相异度随着土壤分类粒度的减小有降低趋势, 从田块到乡镇尺度随样点空间距离增大而显著性增加, 但扩大到县域尺度增加微弱。两种尺度共同作用下, 土壤细菌α多样性指数的变异系数和细菌群落相异度较单一尺度均有所降低;但在乡镇尺度下样点土壤分类粒度降低后, α多样性指数变异系数与群落相异度较乡村尺度的减少更为明显。细菌群落相异度与样点空间距离尺度的相关性较土壤分类粒度更强, 土壤理化性质和农田管理措施在空间上变化是样区空间距离尺度影响土壤细菌群落结构的重要因素。因此, 农田土壤微生物调查, 首先需考虑样点空间距离尺度的影响, 在乡镇以上尺度的样点调查还需进一步考虑土壤分类粒度, 土壤分类粒度越小, 样点越具代表性。研究结果对县域农田土壤微生物多样性研究及其调查样点布设具有积极参考价值。
| [1] |
Balser T C, Firestone M K. Linking microbial community composition and soil processes in a California annual grassland and mixed-conifer forest[J]. Biogeochemistry, 2005, 73(2): 395-415. DOI:10.1007/s10533-004-0372-y
(  0) 0) |
| [2] |
Hodge A, Campbell C D, Fitter A H. An arbuscular mycorrhizal fungus accelerates decomposition and acquires nitrogen directly from organic material[J]. Nature, 2001, 413(6853): 297-299. DOI:10.1038/35095041
(  0) 0) |
| [3] |
Rillig M C, Mummey D L. Mycorrhizas and soil structure[J]. New Phytologist, 2006, 171(1): 41-53. DOI:10.1111/j.1469-8137.2006.01750.x
(  0) 0) |
| [4] |
Liu Z F, Fu B J, Liu G H, et al. Soil quality:Concept, indicators and its assessment (In Chinese)[J]. Acta Ecologica Sinica, 2006, 26(3): 901-913. [刘占锋, 傅伯杰, 刘国华, 等. 土壤质量与土壤质量指标及其评价[J]. 生态学报, 2006, 26(3): 901-913.]
(  0) 0) |
| [5] |
Sun B, Zhao Q G, Zhang T L, et al. Soil quality and sustainable environment:Ⅲ. Biological indicators of soil quality assessment (In Chinese)[J]. Soils, 1997, 29(5): 225-234. [孙波, 赵其国, 张桃林, 等. 土壤质量与持续环境──Ⅲ.土壤质量评价的生物学指标[J]. 土壤, 1997, 29(5): 225-234.]
(  0) 0) |
| [6] |
Huang Y, Huang M K, Chai L W, et al. Drivers of the spatial patterns of soil microbial communities in arid and semi-arid regions (In Chinese)[J]. Ecology and Environmental Sciences, 2018, 27(1): 191-198. [黄艺, 黄木柯, 柴立伟, 等. 干旱半干旱区土壤微生物空间分布格局的成因[J]. 生态环境学报, 2018, 27(1): 191-198.]
(  0) 0) |
| [7] |
Kennedy A C. Bacterial diversity in agroecosystems[J]. Agriculture, Ecosystems & Environment, 1999, 74(1/3): 65-76.
(  0) 0) |
| [8] |
Li H B, Wang Z Q, Wang Q C. Theory and methodology of spatial heterogeneity quantification (In Chinese)[J]. Chinese Journal of Applied Ecology, 1998, 9(6): 651-657. [李哈滨, 王政权, 王庆成. 空间异质性定量研究理论与方法[J]. 应用生态学报, 1998, 9(6): 651-657.]
(  0) 0) |
| [9] |
Pasternak Z, Al-Ashhab A, Gatica J, et al. Spatial and temporal biogeography of soil microbial communities in arid and semiarid regions[J]. PLoS One, 2013, 8(7): e69705. DOI:10.1371/journal.pone.0069705
(  0) 0) |
| [10] |
Steven B, Gallegos-Graves L V, Belnap J, et al. Dryland soil microbial communities display spatial biogeographic patterns associated with soil depth and soil parent material[J]. FEMS Microbiology Ecology, 2013, 86(1): 101-113. DOI:10.1111/1574-6941.12143
(  0) 0) |
| [11] |
Saul-Tcherkas V, Steinberger Y. Soil microbial diversity in the vicinity of a Negev desert shrub-Reaumuria negevensis[J]. Microbial Ecology, 2011, 61(1): 64-81. DOI:10.1007/s00248-010-9763-x
(  0) 0) |
| [12] |
Hortal S, Bastida F, Armas C, et al. Soil microbial community under a nurse-plant species changes in composition, biomass and activity as the nurse grows[J]. Soil Biology and Biochemistry, 2013, 64: 139-146. DOI:10.1016/j.soilbio.2013.04.018
(  0) 0) |
| [13] |
易祎.东北黑土区典型流域农耕地土壤微生物指标的空间变化特征研究[D].陕西杨凌: 西北农林科技大学, 2013. Yi Y. A study on the spatial distribution of soil microbial indicators at the typical watershed of black soil region[D]. Yangling, Shaanxi: Northwest A & F University, 2013. (  0) 0) |
| [14] |
Zhou S, Liang Y T, Zhang H X, et al. Characteristics of spatial pattern and influence factors for soil microbial community structure in moso bamboo forests in middle subtropical China (In Chinese)[J]. Soils, 2015, 47(2): 369-377. [周赛, 梁玉婷, 张厚喜, 等. 我国中亚热带毛竹林土壤微生物群落的空间分布特征及其影响因素[J]. 土壤, 2015, 47(2): 369-377.]
(  0) 0) |
| [15] |
褚海燕, 时玉, 李云涛, 等.我国华北平原麦田土壤微生物的空间分布规律[C].第八次全国土壤生物与生物化学学术研讨会暨第三次全国土壤健康学术研讨会论文摘要集.中国土壤学会土壤生物和生物化学专业委员会, 2015. Chu H Y, Shi Y, Li Y T, et al. Spatial distribution of soil microorganisms in wheat fields of North China Plain[C]. Summary of the 8th National Symposium on Soil Biology and Biochemistry and the Third National Soil Health Symposium. Soil Biology and Biochemistry Committee, Soil Society of China, 2015. (  0) 0) |
| [16] |
Grządziel J, Gałązka A. Microplot long-term experiment reveals strong soil type influence on bacteria composition and its functional diversity[J]. Applied Soil Ecology, 2018, 124: 117-123. DOI:10.1016/j.apsoil.2017.10.033
(  0) 0) |
| [17] |
Chen X, Zhang L M, Shen J P, et al. Soil type determines the abundance and community structure of Ammonia-oxidizing bacteria and Archaea in flooded paddy soils[J]. Journal of Soils and Sediments, 2010, 10(8): 1510-1516. DOI:10.1007/s11368-010-0256-9
(  0) 0) |
| [18] |
Wang D D, Shi X Z, Lu X X, et al. Response of soil organic carbon spatial variability to the expansion of scale in the uplands of Northeast China[J]. Geoderma, 2010, 154(3/4): 302-310.
(  0) 0) |
| [19] |
Yu D S, Yang H, Shi X Z, et al. Effects of soil spatial resolution on quantifying CH4 and N2O emissions from rice fields in the Tai Lake region of China by DNDC model[J]. Global Biogeochemical Cycles, 2011, 25(2): 1-8. DOI:10.1029/2010gb003825
(  0) 0) |
| [20] |
Zhang Z Q, Yu D S, Shi X Z, et al. Effect of sampling classification patterns on SOC variability in the red soil region, China[J]. Soil and Tillage Research, 2010, 110(1): 2-7. DOI:10.1016/j.still.2010.05.007
(  0) 0) |
| [21] |
Pan Y, Lu X S, Yu D S, et al. Quantitative relationships between soil landscape index and classification grain[J]. Journal of Soils and Sediments, 2019, 19(2): 903-916. DOI:10.1007/s11368-018-2093-1
(  0) 0) |
| [22] |
The Office of Changshu Local Chronicles Committee. Changshu Yearbook (In Chinese). Beijing: China Local Press, 2016. [常熟市地方志编纂委员会办公室. 常熟年鉴[M]. 北京: 中国地方出版社, 2016.]
(  0) 0) |
| [23] |
The Office of Changshu General Survey of Soil. Soil Chronicles of Changshu City, Jiangsu Province (In Chinese). Changshu, Jiangsu: Office of Changshu General Survey of Soil, 1985. [常熟市土壤普查办公室. 江苏省常熟土壤年鉴[M]. 江苏常熟: 常熟土壤综合调查办公室, 1985.]
(  0) 0) |
| [24] |
Causey B D. Parametric estimation of the number of classes in a population[J]. Journal of Applied Statistics, 2002, 29(6): 925-934. DOI:10.1080/02664760220136221
(  0) 0) |
| [25] |
Shannon C E, Weaver W. The mathematical theory of communication . University of Illinois Press, 1971.
(  0) 0) |
| [26] |
Simpson E H. Measurement of diversity[J]. Nature, 1949, 163(4148): 688. DOI:10.1038/163688a0
(  0) 0) |
| [27] |
Bray J R, Curtis J T. An ordination of the upland forest communities of southern Wisconsin[J]. Ecological Monographs, 1957, 27(4): 325-349. DOI:10.2307/1942268
(  0) 0) |
| [28] |
Cole J R, Wang Q, Cardenas E, et al. The Ribosomal Database Project:Improved alignments and new tools for rRNA analysis[J]. Nucleic Acids Research, 2009, 37(Database): D141-D145. DOI:10.1093/nar/gkn879
(  0) 0) |
| [29] |
Schloss P D, Gevers D, Westcott S L. Reducing the effects of PCR amplification and sequencing artifacts on 16S rRNA-based studies[J]. PLoS One, 2011, 6(12): e27310. DOI:10.1371/journal.pone.0027310
(  0) 0) |
| [30] |
Clarke K R. Non-parametric multivariate analyses of changes in community structure[J]. Australian Journal of Ecology, 1993, 18(1): 117-143.
(  0) 0) |
| [31] |
Wei Y C, Ouyang Z Y, Miao H, et al. Spatial heterogeneity of soil properties in Jianfengling Nature Reserve (In Chinese)[J]. Chinese Journal of Ecology, 2007, 26(2): 197-203. [魏彦昌, 欧阳志云, 苗鸿, 等. 尖峰岭自然保护区土壤性质空间异质性[J]. 生态学杂志, 2007, 26(2): 197-203.]
(  0) 0) |
| [32] |
Lauber C L, Hamady M, Knight R, et al. Pyrosequencing-based assessment of soil pH as a predictor of soil bacterial community structure at the continental scale[J]. Applied and Environmental Microbiology, 2009, 75(15): 5111-5120. DOI:10.1128/AEM.00335-09
(  0) 0) |
| [33] |
Hansel C M, Fendorf S, Jardine P M, et al. Changes in bacterial and archaeal community structure and functional diversity along a geochemically variable soil profile[J]. Applied and Environmental Microbiology, 2008, 74(5): 1620-1633. DOI:10.1128/AEM.01787-07
(  0) 0) |
| [34] |
黄晶晶.土壤属性空间变异的特征区域幅度及其样点布设应用研究[D].北京: 中国科学院大学, 2019. Huang J J. Study on the characteristic region extent of spatial variability of soil properties and its application on sampling design[D]. Beijing: University of Chinese Academy of Sciences, 2019. (  0) 0) |
| [35] |
王秀虹.单种复合类型单元土壤全量元素空间变异的幅度效应[D].北京: 中国科学院大学, 2017. Wang X H. Scale effect on spatial variability of soil total elements in single complex type unit of land use-soil type[D]. Beijing: University of Chinese Academy of Sciences, 2017. (  0) 0) |
| [36] |
Wang X H, Yu D S, Pan Y, et al. Scale effect on spatial variability of soil total elements in single complex type unit of land use-soil type (In Chinese)[J]. Acta Pedologica Sinica, 2017, 54(4): 864-873. [王秀虹, 于东升, 潘月, 等. 单种复合类型单元土壤全量元素空间变异的幅度效应[J]. 土壤学报, 2017, 54(4): 864-873.]
(  0) 0) |
| [37] |
Habig J, Swanepoel C. Effects of conservation agriculture and fertilization on soil microbial diversity and activity[J]. Environments, 2015, 2(4): 358-384. DOI:10.3390/environments2030358
(  0) 0) |
| [38] |
Deng C C, Li L L, Xie J H, et al. Effects of tillage on soil bacterial community in the dryland farming area of central Gansu (In Chinese)[J]. Acta Pedologica Sinica, 2019, 56(1): 207-216. [邓超超, 李玲玲, 谢军红, 等. 耕作措施对陇中旱农区土壤细菌群落的影响[J]. 土壤学报, 2019, 56(1): 207-216.]
(  0) 0) |
| [39] |
Li Y, Wang B L, Zhu C, et al. RFLP analysis on microbial diversity of dryland soils different in fertilization level (In Chinese)[J]. Acta Pedologica Sinica, 2010, 47(2): 347-353. [李杨, 王保莉, 朱超, 等. 不同施肥水平下旱地土壤细菌群落多样性的RFLP分析[J]. 土壤学报, 2010, 47(2): 347-353.]
(  0) 0) |
| [40] |
Wei Z X, Liang Y L, Shan T Z, et al. Relation of soil microbial diversity to tomato yield and quality under different soil water conditions and fertilizations (In Chinese)[J]. Chinese Journal of Plant Ecology, 2009, 33(3): 580-586. [韦泽秀, 梁银丽, 山田智, 等. 不同水肥条件下番茄土壤微生物群落多样性及其与产量品质的关系[J]. 植物生态学报, 2009, 33(3): 580-586.]
(  0) 0) |
 2021, Vol. 58


