2. 江西省红壤研究所, 国家红壤改良工程技术研究中心, 南昌 330046;
3. 中国农业科学院祁阳农田生态系统国家野外试验站, 湖南祁阳 426182;
4. 农业农村部耕地质量监测保护中心, 北京 100125
2. Jiangxi Institute of Red Soil/National Engineering and Technology Research Center for Red Soil Improvement, Nanchang 330046, China;
3. National Observation Station of Qiyang Agri-ecology System, Institute of Agricultural Resources and Regional Planning, CAAS, Qiyang, Hunan 426182, China;
4. Center of Cultivated Land Quality Monitoring and Protection, Ministry of Agricultural and Rural Affairs, Beijing 100125, China
水稻是我国主要的粮食作物之一,我国约60%以上的人口以稻谷为主食,因此,水稻产量的稳定增长是保障我国粮食安全的根本[1]。而在水稻生产中,土壤有效磷的含量是判定磷肥投入水平的重要因素,对水稻生长起着至关重要的作用。但是,与氮钾相比,磷肥施入土壤后,很容易被土壤颗粒表面或土壤中的铁铝氧化物等吸附转化成作物难以吸收的难溶性磷酸盐[2],导致磷肥当季利用率一般较低,约为10%~25%[3]。同时,农户习惯施肥中磷肥投入常常超出作物实际需磷量,造成土壤中磷素累积量逐渐增加,导致部分稻作区地表和地下水中含磷量严重超标,污染环境[4]。因此,了解稻田土壤磷素的时空演变及其盈亏平衡,提高磷肥利用率的同时降低环境风险是当前的重点和难点。
近年来,在我国南方稻作区,关于土壤磷素的演变特征进行了大量研究。鲁艳红等[5]在研究长期施肥红壤性水稻土的磷素演变特征及对磷盈亏的响应时发现,不施磷肥导致红壤性水稻土磷素的亏缺,而施用化肥磷及化肥磷配施稻草等土壤磷素出现盈余,土壤每盈余磷100 kg·hm–2,全磷含量提高0.03 g·kg–1,有效磷含量提高1.2 mg·kg–1。黄继川等[6]研究表明,广东省水稻土有效磷含量总体处于丰富水平,由于在水稻生产中普遍施用过多的磷肥,与第二次土壤普查结果相比,全省土壤有效磷含量平均提高13.34 mg·kg–1,相对提高87.19%。刘占军[7]在关于我国南方低产水稻土养分特征的研究中指出,南方各低产水稻土区域因不平衡施肥导致有效磷含量空间分布出现显著差异,整体表现为东南高、西南低,其中西南稻区大面积为低磷区域(小于10 mg·kg–1),土壤有效磷表现为亏缺。但是,目前关于土壤磷素时空变异的研究主要集中在特定区域,而有关全国尺度的稻作区土壤磷素时空演变研究鲜有报道。此外,我国稻作区分布广泛,不同稻作区的土壤类型、种植制度和施肥制度差异较大。为此,本文基于农业农村部全国水稻土监测数据,在分析土壤有效磷时空变化、磷肥回收率和磷肥农学效率的基础上,结合各区域磷素表观平衡,深入研究不同区域土壤有效磷含量与磷素盈亏的量化关系,从而为各主要稻作区合理的磷肥施用提供理论参考。
1 材料与方法 1.1 监测点概况基于农业农村部在全国稻作区布置的土壤监测数据库,本研究共计130个稻作区土壤监测点,并划分为东北(黑龙江(3)、吉林(2)和辽宁(1))、长江三角洲(简称“长三角”,江苏(9)、安徽(15)、浙江(2)和上海(3))、长江中游(湖南(28)、江西(7)和湖北(12))、华南(广东(9)、福建(11)、海南(5)和广西(6))和西南(四川(8)、云南(1)、贵州(5)和重庆(3))五个区域(括号内为各区域样点数)。基于上述监测数据库计算,1988年至2017年,东北、长三角、长江中游、华南和西南等区域每年水稻的磷肥投入量平均分别为86.55、80.02、70.91、88.96和70.01 kg·hm–2(以P2O5计),具体试验设计参考文献[8]。
1.2 数据采集和统计分析监测内容主要包括:在每年水稻成熟期,施肥区和无肥区作物产量、秸秆产量、磷肥施用量和土壤有效磷含量。水稻产量采用去边行后实打、实收的方法测定。秸秆产量根据小样本进行籽粒与秸秆生物量比的考种数据换算。土壤样品统一在每年水稻收获之后进行采集,每个监测点用土钻随机采集5个样品,混匀后风干研磨,过2 mm筛后,采用Olsen法[9]测定土壤有效磷含量。水稻籽粒和秸秆含磷量参考文献[10],分别取4 g·kg–1和2 g·kg–1。结合产量和磷肥投入量计算磷肥回收率、磷肥农学效率和磷素累积盈亏量(或磷平衡),具体计算公式如下[5,11]:
磷肥回收率(Phosphorus recovery efficiency,PRE,%)=[施肥区地上部分含磷量(kg·hm–2)-无肥区地上部分含磷量(kg·hm–2)] / [施磷量(kg·hm–2)]×100
磷肥农学效率(Phosphorus agronomy efficiency,PAE,kg·kg–1)=[施肥区水稻籽粒产量(kg·hm–2)-无肥区水稻籽粒产量(kg·hm–2)] / [施磷量(kg·hm–2)]
土壤磷素累积盈亏量(Cumulative phosphorus surplus,kg·hm–2)=∑[当年投入磷总量(kg·hm–2)-当年作物(籽粒+秸秆)吸磷量(kg·hm–2)]
试验数据用Excel 2016整理,采用SigmaPlot 12.5软件进行绘图和拟合,运用SPSS 19统计分析软件进行相关性分析及显著性检验。为避免个别年份点位差异对土壤有效磷含量变化规律造成影响,本研究按照监测点位的施肥年限每隔5年划分成6个阶段,分别为1988—1992年(施肥5 a)、1993—1997年(施肥10 a)、1998—2002年(施肥15 a)、2003—2007年(施肥20 a)、2008—2012年(施肥25 a)和2013—2017年(施肥30 a)。
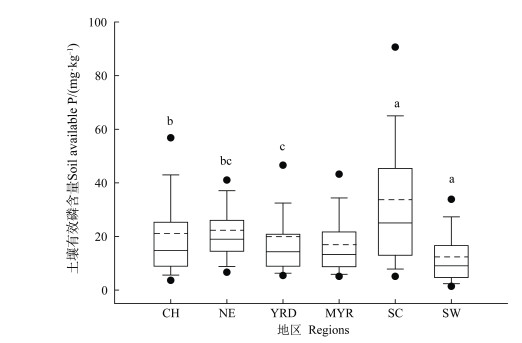
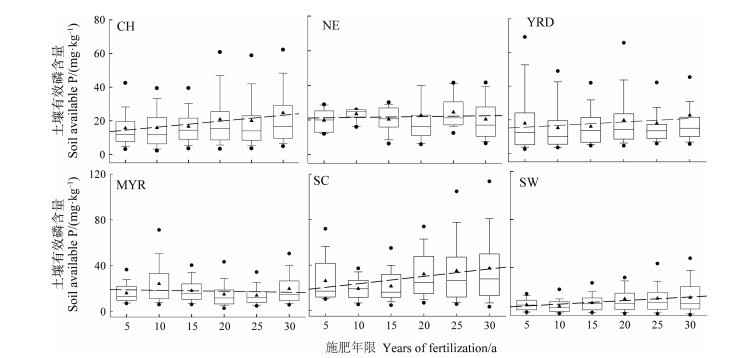
2 结果 2.1 不同区域稻田土壤有效磷的时空变化近30 a来,全国主要稻作区土壤有效磷含量平均值为21.18 mg·kg–1,呈南北高、中间低的趋势,其中以华南和西南区分别为最高和最低(图 1)。各区域的土壤有效磷含量高低顺序依次为:华南、东北、长三角、长江中游和西南,分别为33.71、21.79、20.06、17.24和12.49 mg·kg–1。时间尺度上,全国范围土壤有效磷含量随施肥年限的延长而显著升高(P < 0.05)(图 2),年均增速为0.36 mg·kg–1。线性拟合方程斜率(表 1)表明,东北、长三角和长江中游无明显的变化趋势,华南和西南区土壤有效磷含量随施肥年限的延长而显著升高(P < 0.05),年增速分别为0.65和0.30 mg·kg–1,以华南区增速最快。
|
注:图中不同的小写字母表示差异显著(P < 0.05);实心圆圈“●”为离群值,中间实线代表中位数,虚线代表平均值;上下两条线分别代表 75%和25%的置信区间;上下两个短线分别代表 95%和5%的置信区间。CH:全国;NE:东北;YRD:长江三角洲;MYR:长江中游;SC:华南;SW:西南。下同。 Note:Different lowercases indicate significantly difference(P < 0.05);The solid dots stand for vertical outliers; The solid line in the box represents the median value, and short dash represents the average value. The upper and lower line represent 75% and 25% confidence intervals, respectively. The upper and lower dots represent 95% and 5% confidence intervals, respectively. CH stands for China; NE for Northeast of China; YRD for Yangtze River Delta; MYR for the Middle Reaches of the Yangtze River; SC for South of China; and SW for Southwest of China. The same below. 图 1 不同区域稻田土壤有效磷含量 Fig. 1 Available phosphorous content in the soil of paddy fields relative to region |
|
注:▲代表平均值;虚斜线表示土壤有效磷与施肥年限的拟合趋势。下同。 Note:▲ represents the average value. Dotted slashes indicate the fit curve between soil available phosphorous and duration of the experiment. The same below. 图 2 不同区域稻田土壤有效磷含量30 a变化趋势 Fig. 2 Variation of soil available phosphorous content in paddy soil during the past 30 years relative to region |
|
|
表 1 不同区域稻田土壤有效磷含量(y)与施肥年限(x)的相关性 Table 1 Correlation between soil available phosphorous content in paddy soil (y) and years of the fertilization (x) relative to region |
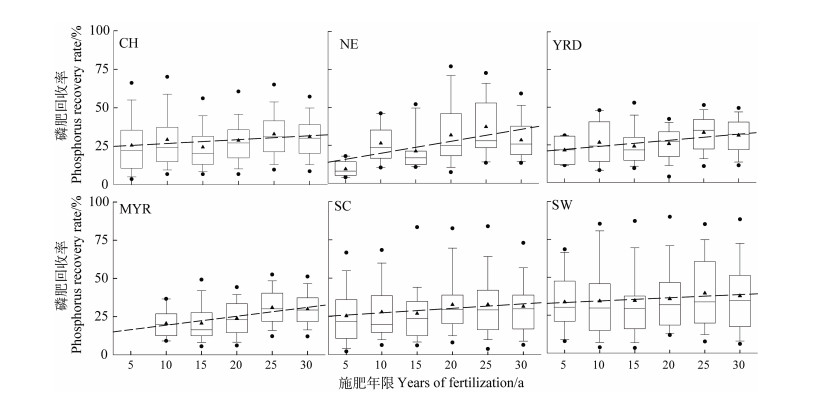
由图 3及表 2可知,全国稻田土壤磷肥回收率平均值为28.03%,长江中游、东北、长三角、华南和西南区磷肥回收率分别为25.2%、25.71%、27.04%、29.49%和35.92%,由北向南逐渐升高,并以西南区最高。磷肥回收率随施肥年限的延长而显著增加(P < 0.05),全国平均增速为0.32%。东北、长江中游、长三角、华南和西南区年均增加速率分别为0.79%、0.58%、0.4%、0.29%和0.21%,以东北区增速最快。
|
注:虚斜线表示土壤磷肥回收率与施肥年限的拟合趋势;长江中游区因1988—1992年无肥区产量数据不足,无法计算磷肥回收率。 Note:Dotted slashes indicate the fitting curve between phosphorus recovery rate and years of experiment; Phosphorus recovery rate could not be calculated due to insufficient yield data of no-fertilizer area from 1988 to 1992 in MYR. 图 3 不同区域稻田土壤磷肥回收率30 a变化趋势 Fig. 3 Variation of phosphorus recovery rate in paddy fields during the past 30 years relative to region |
|
|
表 2 不同区域稻田土壤磷肥回收率(y)与施肥年限(x)的相关性 Table 2 Correlation between phosphorus recovery rate in paddy soil (y) and years of fertilization (x) relative to region |
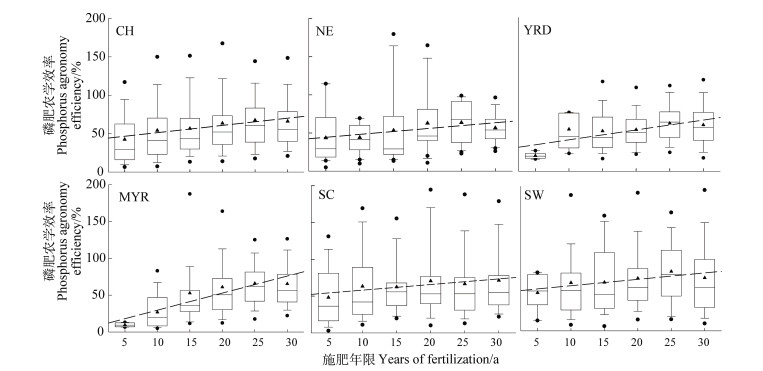
全国稻田磷肥农学效率平均为58.48 kg·kg–1,长江中游、长三角、东北、华南和西南区磷肥农学效率平均分别为46.83、49.83、53.99、63.72和69.02 kg·kg–1,在全国范围内呈南北高、中间低的趋势,以西南区最高,说明西南区更需要重视磷肥的施用。全国稻田磷肥农学效率随施肥年份的延长而显著提高(P < 0.01),年均升高0.94 kg·kg–1。各区域磷肥农学效率呈现与全国相似趋势,长江中游、长三角、东北、西南和华南区磷肥农学效率年均增加分别为2.32、1.29、0.89、0.89和0.76 kg·kg–1,可见,长江中游区的磷肥施用增产效果优于其他区域。
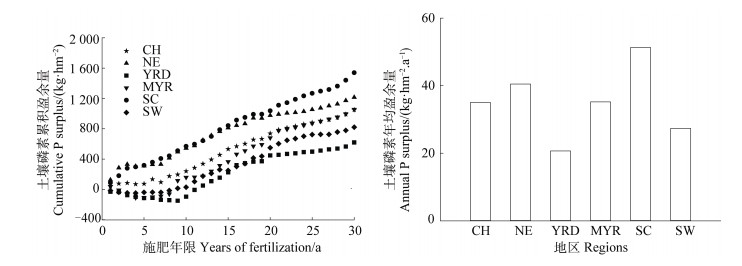
2.4 不同区域稻田土壤有效磷含量对磷平衡的响应由图 5可知,全国主要稻田土壤中磷素累积量随施肥年限的延长逐渐增加,年均磷盈余量为35.03 kg·hm–2,约占磷肥平均投入量的44.16%。各区域均表现为盈余状态,年均盈余在20.69~51.31 kg·hm–2之间,占磷肥施入量的42.73%~52.56%。磷素累积盈余量呈南北高、中间低的趋势,并以华南区最高,长三角区最低。土壤磷素累积盈余量随化学磷肥和有机磷肥施入总量的增加而显著增加(y= 1.020 x - 42.70,R2 = 0.950,n=23)。其中,长三角、长江中游和西南区早期因磷肥投入量较低出现短暂亏缺状态,随施肥年限的延长及施磷量的增加,逐渐出现盈余。
|
注:虚斜线表示土壤磷肥农学效率与施肥年限的拟合趋势。 Note:Dotted slashes indicate the fitting curve between phosphorus agronomy efficiency and years of fertilization. 图 4 不同区域稻田土壤磷肥农学效率30 a变化趋势 Fig. 4 Variation of phosphorus agronomic efficiency in paddy fields during the past 30 years relative to region |
|
图 5 近30 a不同区域稻田土壤磷素累积盈余量变化 Fig. 5 Variation of cumulative phosphorus surplus of paddy soil during the past 30 years relative to region |
|
|
表 3 不同区域稻田土壤磷肥农学效率(y)与施肥年限(x)的相关性 Table 3 Correlation between phosphorus agronomic efficiency in paddy fields (y) and years of fertilization (x) relative to region |
由图 6可知,就全国范围而言,土壤有效磷含量与磷素累积盈余量呈显著正相关关系(P < 0.05),土壤中平均每盈余磷素100 kg·hm–2,土壤有效磷含量增加0.82 mg·kg–1。华南和西南区也呈现显著增加趋势,土壤中每累积盈余磷素100 kg·hm–2,土壤有效磷含量分别增加2.25和0.85 mg·kg–1。东北、长三角和长江中游区土壤有效磷含量分别在21.79、20.06、17.24 mg·kg–1左右浮动,与土壤磷素累积盈余量之间相关关系不显著。

|
注:斜线表示土壤磷肥农学效率与施肥年限的拟合趋势;n表示样本数;**表示相关性达到极显著水平(P < 0.01)。 Note:Slashes indicate the fitting curve between cumulative phosphorus surplus and soil available phosphorus; n represents the number of samples; **means significant correlation at 0.01 level. 图 6 不同区域土壤有效磷含量与磷素累积盈余量的相关分析 Fig. 6 Correlation analysis of soil available phosphorus content of paddy soil with cumulative phosphorus surplus relative to region |
土壤有效磷常用作衡量土壤供磷能力和评估磷素流失风险,而农田养分平衡的研究有助于从宏观上观察农田养分的时间变化和可能存在的问题[12]。近30 a来,全国主要稻作区土壤有效磷含量平均为21.18 mg·kg–1,随施肥年限的延长,土壤磷素累积盈余量逐年增加,土壤有效磷含量以每年0.36 mg·kg–1的速率显著升高(图 1、图 5和图 6;表 1)。展晓莹等[13]研究表明,全国21个监测点在15~25 a的监测期间,土壤有效磷含量呈显著增加趋势,年均增加量为0.74 mg·kg–1,年均增速高于本研究结果,可能的原因:首先,其监测点分布较广但监测点位数(28个)较本研究监测点位数(130个)少;其次,本研究监测范围集中在全国除西北和华北外的稻田土壤,并不涵盖旱地土壤,而稻田土壤由于淹水降低土壤氧化还原电位,提高土壤中无定形态氧化铁含量,增强了土壤对磷的吸附能力,从而降低磷素的有效性和有效磷的平均含量[14]。
土壤磷素累积盈余量主要由磷素投入量和作物带走量决定,由于作物对磷素的吸收能力有限,随着施肥年限的延长和施磷量的增加,土壤磷素累积盈余量逐渐增加,导致土壤有效磷含量也逐渐升高[15-16]。土壤中磷素每盈余100 kg·hm–2,土壤有效磷含量平均增加0.82 mg·kg–1,华南和西南区平均分别增加2.25和0.85 mg·kg–1,该结果与之前的研究[17-19]一致。
然而,施肥方式、磷肥投入量、耕作模式、气候条件及土壤类型的不同均导致各区域磷素累积的速率不同,土壤有效磷含量及年均增速各不相同[18]。东北区一次性施肥比例较高,施肥量也有逐渐上升的趋势[20-21],但耕作模式为一年一熟,作物收获带走量较低,所以东北区磷素累积量较高且累积速率较快。但是东北区土壤有效磷含量的年均增速并不高,约为0.05 mg·kg–1,且土壤有效磷含量与磷素累积盈余量之间并无显著正相关关系(P > 0.05,图 6),可能是因为土壤中存在磷素累积阈值,当土壤中磷素累积未超过磷素累积阈值时,土壤有效磷含量会受年际间降水、年际均温及土壤组分(有机质和黏粒含量)等影响而上下波动[22]。长三角和长江中游区主要土壤类型为潮土和红壤,土壤中含有丰富的碳酸盐和铁铝氧化物,黏粒含量较高,对磷素有较强的吸附作用[23-24]。过量的磷被吸附在土壤中,当未超过磷素累积阈值时,出现与东北区相似趋势,年际间土壤有效磷含量变化不显著[13,18]。华南区土壤有效磷含量较高,年均增速也较快,可能因为:第一,华南稻作区主要为稻-稻-菜的耕作模式,蔬菜种植季节大量磷肥的投入(年均磷肥投入量为88.96 kg·hm–2(以P2O5计,下同)),导致磷素累积速率较高[6];第二,土壤中有机质与磷酸盐竞争铁铝氧化物的表面结合位点[25-26],华南区稻田土壤大多为三角洲沉积物,有机质含量较高,而且近年来有机质含量仍呈升高趋势[6],有机质含量的增加因竞争作用促进土壤中铁铝氧化物释放吸附态磷,增加土壤有效磷含量[27-28];第三,华南区属亚热带和热带季风气候区,在水稻生长季节,较高的水温和土温,有利于有效磷的释放和移动[29]。西南区土壤有效磷含量较低,平均为12.49 mg·kg–1,土壤磷素累积盈余量因施磷量较低(70.01 kg·hm–2)而增速缓慢,导致土壤有效磷含量年均增速也低,约为0.3 mg·kg–1,这与刘占军[7]的研究结果类似。除上述因素外,土壤有效磷含量还受土壤pH[30]和磷肥类型[31]的影响。
3.2 不同区域稻田土壤磷肥回收率与农学效率的变化趋势全国主要稻作区土壤磷肥回收率和农学效率均随施肥年限的延长而提高(图 3和图 4),这与其他关于长期施肥下农田磷肥回收率和农学效率的研究结果[32-33]一致,表明磷肥在水稻的增产中仍发挥着巨大作用,且长期均衡施肥可促进作物对磷素的吸收[34]。但是,由于施肥用量和模式、种植模式及土壤性质的不同,各区域土壤磷肥回收率和农学效率的年均增速出现差异。西南区年均磷肥投入量最低,为70.01 kg·hm–2,且监测前期出现短暂磷素亏缺。由于施肥量较低,无法满足作物生长需求,导致施磷后回收率和农学效率持续升高。其次,由于底层土壤含有25%~70%作物可利用的全磷,可贡献作物所需的超过1/3磷素,给作物提供除当季磷肥投入以外的磷源[35]。东北区年均磷肥投入为86.55 kg·hm–2,仅次于华南区(88.96 kg·hm–2),但其磷肥回收率和农学效率均低于华南区,主要由于东北区土壤类型以黑土为主,黑土磷储量较高,给予作物较高的养分供应,降低了对外源磷肥的依赖[36]。
随着施肥年限的延长和施磷量的增加,土壤中磷素累积盈余量逐渐增加,有些区域甚至已明显超过土壤对磷素的容纳量[37]。所以,在磷肥施用不再是作物产量提升的限制因素或者当磷肥施用的增产效果较低时,应该考虑如何提高磷肥利用率。但不同区域则需要根据耕作模式及土壤特性调整施磷方式,在保证产量的同时提高磷肥利用率,减少面源污染风险。例如,西南区土壤磷素累积盈余量较低、磷肥回收率及农学效率较高,应注重增施磷肥或配施有机肥,以保证作物的正常磷素需求。华南区土壤有效磷含量总体偏高,磷素累积盈余量较高,但磷肥回收率及农学效率较低,应减少磷肥施用量,提高磷素利用率。
4 结论近30 a来,全国稻田土壤有效磷含量平均值为21.18 mg·kg–1,并随施肥年限的延长而显著提高。各区域土壤磷素累积均表现为盈余状态,平均每盈余磷素100 kg·hm–2,土壤有效磷含量增加0.82 mg·kg–1。各区域土壤有效磷含量由高到低依次为:华南、东北、长三角、长江中游、西南,磷素累积盈余量由高到低依次为:华南、东北、长江中游、西南、长三角,磷肥农学效率高低顺序依次为:西南、华南、长三角、东北、长江中游。各区域磷肥回收率和农学效率均随施肥年限的延长而升高,但各区域增幅明显不同。综上,建议西南区适当增加施磷量,华南区合理减少磷肥投入,降低面源污染风险。
致谢 在此对Waqas Ahmed、Asad Shah和Nano Alemu为英文摘要提出的修改建议表示衷心的感谢!
| [1] |
Jiang S T, Wang H Y, Zhou J M, et al. Effects of application methods of phosphorus fertilizers on the growth and phosphorus absorption of rice in Jiangyan and Guangde regions (In Chinese)[J]. Soils, 2016, 48(6): 1085-1091. [江尚焘, 王火焰, 周健民, 等. 磷肥施用对水稻生长和磷素吸收的影响[J]. 土壤, 2016, 48(6): 1085-1091.]
(  0) 0) |
| [2] |
Li S T, Zhou J M, Wang H Y, et al. Characteristics of fixation and release of phosphorus in three soils (In Chinese)[J]. Acta Pedologica Sinica, 2003, 40(6): 908-914. DOI:10.3321/j.issn:0564-3929.2003.06.016 [李寿田, 周健民, 王火焰, 等. 不同土壤磷的固定特征及磷释放量和释放率的研究[J]. 土壤学报, 2003, 40(6): 908-914.]
(  0) 0) |
| [3] |
Yang K, Guan L Z, Zhu J J, et al. Effects of extraneous humic acids on inorganic phosphorus fractions in three different soils (In Chinese)[J]. Acta Pedologica Sinica, 2009, 46(6): 1172-1175. DOI:10.3321/j.issn:0564-3929.2009.06.029 [杨凯, 关连珠, 朱教君, 等. 外源腐殖酸对三种土壤无机磷组分的影响[J]. 土壤学报, 2009, 46(6): 1172-1175.]
(  0) 0) |
| [4] |
Jia X P, Liu Q, Zhang H C. The influencing factors of adsorption to phosphorus in the different types of paddy soils (In Chinese)[J]. Journal of Henan Institute of Science and Technology(Natural Science Edition), 2015, 43(4): 7-13. DOI:10.3969/j.issn.1008-7516.2015.04.002 [贾学萍, 刘勤, 张焕朝. 不同水稻土对磷吸附的影响因素研究[J]. 河南科技学院学报(自然科学版), 2015, 43(4): 7-13.]
(  0) 0) |
| [5] |
Lu Y H, Liao Y L, Nie J, et al. Evolution of soil phosphorus in reddish paddy soil under long-term fertilization varying in formulation and its response to P balance (In Chinese)[J]. Acta Pedologica Sinica, 2017, 54(6): 1471-1485. [鲁艳红, 廖育林, 聂军, 等. 长期施肥红壤性水稻土磷素演变特征及对磷盈亏的响应[J]. 土壤学报, 2017, 54(6): 1471-1485.]
(  0) 0) |
| [6] |
Huang J C, Peng Z P, Xu P Z, et al. Investigation on organic matter, nitrogen, phosphorus and potassium of paddy soil in Guangdong province (In Chinese)[J]. Guangdong Agricultural Sciences, 2014, 41(6): 70-73. DOI:10.3969/j.issn.1004-874X.2014.06.019 [黄继川, 彭智平, 徐培智, 等. 广东省水稻土有机质和氮、磷、钾肥力调查[J]. 广东农业科学, 2014, 41(6): 70-73.]
(  0) 0) |
| [7] |
刘占军.我国南方低产水稻土养分特征与质量评价[D].北京: 中国农业大学, 2014. Liu Z J. Nutrient characteristics and quality assessment of low-yield paddy soils in South China[D]. Beijing: China Agricultural University, 2014. (  0) 0) |
| [8] |
Han T F, Ma C B, Huang J, et al. Variation in rice yield response to fertilization in China:Meta-analysis (In Chinese)[J]. Scientia Agricultura Sinica, 2019, 52(11): 1918-1929. DOI:10.3864/j.issn.0578-1752.2019.11.007 [韩天富, 马常宝, 黄晶, 等. 基于Meta分析中国水稻产量对施肥的响应特征[J]. 中国农业科学, 2019, 52(11): 1918-1929.]
(  0) 0) |
| [9] |
Lu R K. Analytical methods for soil and agro- chemistry (In Chinese). Beijing: China Agricultural Science and Technology Press, 2000. [鲁如坤. 土壤农业化学分析方法[M]. 北京: 中国农业科技出版社, 2000.]
(  0) 0) |
| [10] |
Lu R K, Liu H X, Wen D Z, et al. Research on nutrient cycle and balance in agricultural eco-system in Chinese typical regionsⅠ. Parameters of nutrient output in farmland (In Chinese)[J]. Chinese Journal of Soil Science, 1996, 27(4): 151-154. [鲁如坤, 刘鸿翔, 闻大中, 等. 我国典型地区农业生态系统养分循环和平衡研究Ⅰ.农田养分支出参数[J]. 土壤通报, 1996, 27(4): 151-154.]
(  0) 0) |
| [11] |
Huang J, Zhang Y Z, Xu M G, et al. Evolution characteristics of soil available phosphorus and its response to soil phosphorus balance in paddy soil derived from red earth under long-term fertilization (In Chinese)[J]. Scientia Agricultura Sinica, 2016, 49(6): 1132-1141. [黄晶, 张杨珠, 徐明岗, 等. 长期施肥下红壤性水稻土有效磷的演变特征及对磷平衡的响应[J]. 中国农业科学, 2016, 49(6): 1132-1141.]
(  0) 0) |
| [12] |
Lu R K, Shi Z Y, Shi J P. Nutrient balance of agroecosystem in six provinces in southern China (In Chinese)[J]. Scientia Agricultura Sinica, 2000, 33(2): 63-67. DOI:10.3321/j.issn:0578-1752.2000.02.010 [鲁如坤, 时正元, 施建平. 我国南方6省农田养分平衡现状评价和动态变化研究[J]. 中国农业科学, 2000, 33(2): 63-67.]
(  0) 0) |
| [13] |
Zhan X Y, Ren Y, Zhang S X, et al. Changes in Olsen phosphorus concentration and its response to phosphorus balance in the main types of soil in China (In Chinese)[J]. Scientia Agricultura Sinica, 2015, 48(23): 4728-4737. DOI:10.3864/j.issn.0578-1752.2015.23.014 [展晓莹, 任意, 张淑香, 等. 中国主要土壤有效磷演变及其与磷平衡的响应关系[J]. 中国农业科学, 2015, 48(23): 4728-4737.]
(  0) 0) |
| [14] |
苏玲.水稻土淹水过程中铁化学行为变化对磷有效性影响研究[D].杭州: 浙江大学, 2001. Su L. Effect of transformation of iron and phosphorus chemical behavior on phosphorus availability in flooded paddy soil[D]. Hangzhou: Zhejiang University, 2001. (  0) 0) |
| [15] |
Ma J, Liu Y, He W, et al. The long-term soil phosphorus balance across Chinese arable land[J]. Soil Use and Management, 2018, 34(3): 306-315. DOI:10.1111/sum.12438
(  0) 0) |
| [16] |
Shen P, Xu M G, Zhang H M, et al. Long-term response of soil Olsen P and organic C to the depletion or addition of chemical and organic fertilizers[J]. Catena, 2014, 118: 20-27. DOI:10.1016/j.catena.2014.01.020
(  0) 0) |
| [17] |
Yang Z X, Zhou H P, Xie W Y, et al. Response of Olsen-P to P balance in cinnamon soil under long-term fertilization (In Chinese)[J]. Journal of Plant Nutrition and Fertilizer, 2015, 21(6): 1529-1535. [杨振兴, 周怀平, 解文艳, 等. 长期施肥褐土有效磷对磷盈亏的响应[J]. 植物营养与肥料学报, 2015, 21(6): 1529-1535.]
(  0) 0) |
| [18] |
Liu Y L, Li Y, Zhang Y R, et al. Effect of long-term fertilization on the P balance and critical value of soil Olsen-P in paddy soil from yellow earth (In Chinese)[J]. Scientia Agricultura Sinica, 2016, 49(10): 1903-1912. DOI:10.3864/j.issn.0578-1752.2016.10.007 [刘彦伶, 李渝, 张雅蓉, 等. 长期施肥对黄壤性水稻土磷平衡及农学阈值的影响[J]. 中国农业科学, 2016, 49(10): 1903-1912.]
(  0) 0) |
| [19] |
Li X P, Zou M L, Ren J Y. Effects of long-term fertilization on phosphorus accumulation and migration in purple soil[J]. Meteorological and Environmental Research, 2015, 6(8-9): 46-49.
(  0) 0) |
| [20] |
Gao Q, Feng G Z, Wang Z G. Present situation of fertilizer application on spring maize in northeast China (In Chinese)[J]. Chinese Agricultural Science Bulletin, 2010, 26(14): 229-231. [高强, 冯国忠, 王志刚. 东北地区春玉米施肥现状调查[J]. 中国农学通报, 2010, 26(14): 229-231.]
(  0) 0) |
| [21] |
Su X P, Wu D L, Xia T T, et al. Investigation on current status of nitrogen application in spring maize in the farmers of Lishu County Jilin Province (In Chinese)[J]. Journal of Jilin Agricultural Sciences, 2015, 40(5): 46-48, 70. [苏效坡, 伍大利, 夏婷婷, 等. 吉林省梨树县农户春玉米氮肥施用现状调查[J]. 吉林农业科学, 2015, 40(5): 46-48, 70.]
(  0) 0) |
| [22] |
Zhang W W, Zhan X Y, Zhang S X, et al. Response of soil Olsen-P to P budget under different long-term fertilization treatments in a fluvo-aquic soil[J]. Journal of Integrative Agriculture, 2019, 18(3): 667-676. DOI:10.1016/S2095-3119(18)62070-2
(  0) 0) |
| [23] |
Song C L, Fan J B, He Y Q, et al. Phosphorous adsorption characteristics of red paddy soils derived from different parent materials and their influencing factors (In Chinese)[J]. Acta Pedologica Sinica, 2012, 49(3): 607-611. [宋春丽, 樊剑波, 何园球, 等. 不同母质发育的红壤性水稻土磷素吸附特性及其影响因素的研究[J]. 土壤学报, 2012, 49(3): 607-611.]
(  0) 0) |
| [24] |
Gong L T, Shi L, Cai R M. Effects of mineral conditioner on soil nutrient contents and nutrient absorption by lettuce (In Chinese)[J]. Soils, 2019, 51(5): 916-922. [龚玲婷, 石林, 蔡如梦. 矿物质调理剂对土壤养分含量及植物营养吸收的影响[J]. 土壤, 2019, 51(5): 916-922.]
(  0) 0) |
| [25] |
Guan X H, Shang C, Chen G H. Competitive adsorption of organic matter with phosphate on aluminum hydroxide[J]. Journal of Colloid and Interface Science, 2006, 296(1): 51-58. DOI:10.1016/j.jcis.2005.08.050
(  0) 0) |
| [26] |
Wang H, Zhu J, Fu Q L, et al. Adsorption of phosphate onto ferrihydrite and ferrihydrite-humic acid complexes[J]. Pedosphere, 2015, 25(3): 405-414. DOI:10.1016/S1002-0160(15)30008-4
(  0) 0) |
| [27] |
Guppy C N, Menzies N W, Moody P W, et al. Competitive sorption reactions between phosphorus and organic matter in soil:A review[J]. Australian Journal of Soil Research, 2005, 43(2): 189-202. DOI:10.1071/SR04049
(  0) 0) |
| [28] |
Fink J R, Inda A V, Tiecher T, et al. Iron oxides and organic matter on soil phosphorus availability[J]. Ciência e Agrotecnologia, 2016, 40(4): 369-379. DOI:10.1590/1413-70542016404023016
(  0) 0) |
| [29] |
Bruun T B, Mertz O, Elberling B. Linking yields of upland rice in shifting cultivation to fallow length and soil properties[J]. Agriculture, Ecosystems & Environment, 2006, 113(1): 139-149.
(  0) 0) |
| [30] |
Lü C, Yan D H, He J, et al. Environmental geochemistry significance of organic phosphorus:An insight from its adsorption on iron oxides[J]. Applied Geochemistry, 2017, 84: 52-60. DOI:10.1016/j.apgeochem.2017.05.026
(  0) 0) |
| [31] |
Hong X, Ma C, Gao J S, et al. Effects of different green manure treatments on soil apparent N and P balance under a 34-year double-rice cropping system[J]. Journal of Soils and Sediments, 2019, 19(1): 73-80. DOI:10.1007/s11368-018-2049-5
(  0) 0) |
| [32] |
Huang J, Zhang S X, Shi X J, et al. Change of phosphorus recovery efficiency under long-term fertilization in typical farmland in southern China (In Chinese)[J]. Journal of Plant Nutrition and Fertilizers, 2018, 24(6): 1630-1639. [黄晶, 张淑香, 石孝均, 等. 长期不同施肥模式下南方典型农田磷肥回收率变化[J]. 植物营养与肥料学报, 2018, 24(6): 1630-1639.]
(  0) 0) |
| [33] |
Xin X L, Qin S W, Zhang J B, et al. Yield, phosphorus use efficiency and balance response to substituting long-term chemical fertilizer use with organic manure in a wheat-maize system[J]. Field Crops Research, 2017, 208: 27-33. DOI:10.1016/j.fcr.2017.03.011
(  0) 0) |
| [34] |
Liao Y L, Lu Y H, Nie J, et al. Effects of long-term fertilization on basic soil productivity and nutrient use efficiency in paddy soils (In Chinese)[J]. Journal of Plant Nutrition and Fertilizer, 2016, 22(5): 1249-1258. [廖育林, 鲁艳红, 聂军, 等. 长期施肥稻田土壤基础地力和养分利用效率变化特征[J]. 植物营养与肥料学报, 2016, 22(5): 1249-1258.]
(  0) 0) |
| [35] |
van der Bom F J T, McLaren T I, Doolette A L, et al. Influence of long-term phosphorus fertilization history on the availability and chemical nature of soil phosphorus[J]. Geoderma, 2019, 355: 113909. DOI:10.1016/j.geoderma.2019.113909
(  0) 0) |
| [36] |
Qiu S J, Li N, He P, et al. Nutrients use efficiency change of chemical fertilizers for spring maize in a typical black soil (In Chinese)[J]. Scientia Agricultura Sinica, 2019, 52(16): 2824-2834. DOI:10.3864/j.issn.0578-1752.2019.16.008 [仇少君, 李宁, 何萍, 等. 典型黑土春玉米化学肥料养分利用效率变化研究[J]. 中国农业科学, 2019, 52(16): 2824-2834.]
(  0) 0) |
| [37] |
展晓莹.长期不同施肥模式黑土有效磷与磷盈亏响应关系差异的机理[D].北京: 中国农业科学院, 2016. Zhan X Y. Relationship between available phosphorus and phosphorus balance and its mechanism under different long-term fertilizations in black soil[D]. Beijing: Chinese Academy of Agricultural Sciences, 2016. (  0) 0) |
 2021, Vol. 58


