土壤颜色是判断成土环境、土壤发育程度及肥力特征的重要依据之一,在土壤发生、分类研究中具有重要意义,氧化铁是其主要影响因素之一[1-3]。颜色是土壤在可见光波段的反射光谱特征,而在决定反射光谱特征最重要的土壤化学成分中,仅有Fe在可见-近红外波段具有光谱特征[4],因此可利用土壤颜色或光谱数据对土壤氧化铁进行反演预测。Fe在土壤中主要以铁氧化物的形式存在,大部分呈游离态,作为土壤中重要的矿物胶结组织[5],游离铁不仅显著影响土壤颜色,还能反映土壤的发生演变。近年来,国内外已有多项研究成功利用土壤光谱数据建立游离铁含量预测模型[6-9],但多基于对模型算法的讨论,基于土壤颜色反演游离铁的研究报道还甚少。
在众多色空间/色度指标中,土壤科学中主要采用Munsell色空间,土壤系统分类以此为依据绘制色卡判别土壤颜色[10]。但随着光学技术的进步,色卡精度低、易受环境条件[11-13]影响的缺点已经无法忽视,而测色仪器则更为精确客观,可以提供更多有价值的信息,促进了土壤颜色的研究和应用。相比昂贵的大型光谱仪[14]和误差不定、参数有限的相机等便携式拍摄装置[15],便携式分光测色仪可同时获得各色度参数和光谱数据,校正、测试方便,性价比高[16],在土壤颜色相关方面研究优势明显。
川中丘陵区遍布紫色土,其土色包括紫红、红、红黄等一系列颜色,氧化铁平均含量介于34.7~170.9 g·kg–1,低于我国土壤平均值,但略高于世界土壤平均值,土样之间变异系数较大[17],较适宜用于定量研究土壤颜色与游离铁之间的关系。因此,本研究以川中丘陵区典型土系为研究对象,利用化学方法测定游离铁含量,利用分光测色仪测定Munsell颜色及其光谱数据,探究利用Munsell颜色预测土壤游离铁含量的可行性。
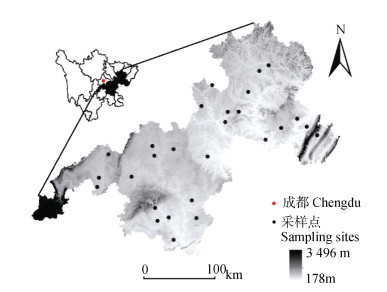
1 材料与方法 1.1 研究区概况供试的27个典型土系位于川中丘陵区(图 1),地跨103°15′~108°30′E、27°35′~32°52′N,地处长江以北,沱江、涪江、嘉陵江、渠江等中下游,属典型方山丘陵,属亚热带湿润季风气候,出露地层多为中生界侏罗系中上统的紫红色泥岩和砂岩,土壤类型主要为紫色土(发生分类)。

|
图 1 供试典型土系的剖面样点位置 Fig. 1 Sites of studied profiles of typical soil series |
于2015—2016年进行土样采集,每个剖面依据发生层次自下而上采集分析样品,共97个土样。由于新鲜土样可能因土块大小不一或水分含量不等/含水量过饱和现象[18]造成色彩均一性较差,对颜色测定产生不同程度的影响,因此不在野外或室内对所采的新鲜土样直接进行颜色测定,而是将土样经过室内自然风干、去杂、研磨过10目(2.0 mm)、60目(0.250 mm)和100目(0.149 mm)尼龙筛后备用。
1.3 土壤理化性质测定土壤全铁(Fet,过100目筛土样)和游离铁(Fed,过60目筛土样)分别采用碳酸锂-硼酸熔融、DCB浸提,电感耦合等离子发射光谱仪(ICP-AES)法测定[19]。
Munsell颜色及光谱数据利用日本Konica Minolta公司CM600d分光测色仪测定。将过10目的土样置于配套粉末测试装置,使样品略多于装置,拧紧装置盖;设置测定参数为观测角度2°、内置C光源,选用8 mm测色稳定片;进行零校正与白板校正后将测定端置于粉末测试装置中测定,同一土样重复测定3次,获取Munsell色空间的色调、明度、彩度参数及光谱数据。
1.4 数据处理及模型建立(1)土壤颜色、光谱数据处理。Munsell色空间中的色调由数字与英文颜色缩写组合而成,如2.5R,2.5YR,2.5Y等,本研究中将2.5R计为2.5、2.5YR计为12.5、2.5Y计为22.5[20],以此类推;明度、彩度则以测定值为准。
CM600d测色仪以10 nm为间隔获取400~690 nm部分可见光波段土壤反射光谱数据,并计算各波段间反射率一阶导数值,以避免原始反射光谱曲线较平滑的现象,突出光谱特征[21]。
(2)数据处理与模型建立及检验。数据统计分析及图形绘制使用Microsoft Excel 2016软件,土壤Fed含量和铁游离度(Fed/Fet,%)与色调、明度、彩度值之间Pearson相关分析使用IBM Statistics SPSS 22.0软件,使用MATLAB R2016a将数据随机划分70%为固定训练集、30%为固定测试集并建立反演模型。
研究采用BP神经网络模型[22-23],模型由输入层、单隐含层、输出层组成。隐含层神经元个数根据经验公式(1)计算得到:
| $ M = {(m + n)^{1/2}} + a $ | (1) |
式中,M为隐含层神经元个数,m为输入层神经元个数,n为输出层神经元个数,a为[0,10]间任意常数。隐含层传递函数为tansig,输出层函数为purelin,训练方法为Levenberg-Marquardt,迭代次数为1 000,预期目标为0.001,学习速率为0.01,最后采用sim仿真函数验证。
模型拟合度及预测精度检验采用R2(决定系数)、RMSE(均方根误差)、RPD(相对分析误差)判断。R2越大,RMSE越小,模型拟合度越好,预测精度越高,反之越差。对于土壤,研究认为,RPD < 1.5,模型预测精度较低;1.5 < RPD < 2.0,模型预测精度可接受;RPD > 2.0,模型精度较高[24]。
2 结果 2.1 土壤游离铁和颜色特征按铁游离度的分级列出了土样数量以及测定获取的土样游离铁和颜色指标的平均值,具体见表 1。供试土壤游离铁含量介于4.43~81.75 g·kg–1,平均为20.18 g·kg–1,铁游离度介于16.71%~79.61%。风干土Munsell颜色色调介于13.50~21.60,集中于YR色调,明度介于3.89~6.72,彩度介于1.97~5.16。由表 1可以看出,随土壤游离铁含量和铁游离度的上升,色调呈不规则变化,但明度和彩度总体上均呈现逐渐升高的趋势。
|
|
表 1 研究区土壤游离铁及Munsell颜色描述性统计 Table 1 Descriptive statistics of Fed and Munsell color of the soils in the research area |
从表 2中Pearson相关系数可以看到,土壤游离铁含量与色调在P < 0.05水平上呈显著正相关,铁游离度与色调在P < 0.01水平上呈显著正相关,两者与明度、彩度在P < 0.01水平上均呈显著正相关。表明土壤色调越黄,明度和彩度越高,土壤游离铁含量和铁游离度越高。
|
|
表 2 土壤游离铁与Munsell颜色的Pearson相关关系 Table 2 Pearson correlation coefficients between soil Fed and Munsell color parameters |
将Munsell色调、明度、彩度作为输入层,游离铁含量作为输出层,随机划分70%为固定训练集、30%为固定测试集,采用最大最小法进行数据归一化、归一化函数采用mapminmax函数,数据反归一化利用reverse语句完成。
由表 3可知,隐含层神经元个数不同,模型拟合度、精度不同。当隐藏层神经元个数小于4时,训练集未满足预期值≤0.001,达到预期值后隐含层神经元个数继续增加,测试集RMSE总体呈增大趋势、RPD总体呈减小趋势;当隐含层神经元个数满足预期值且RMSE最小、RPD最大时为宜,可知Munsell颜色模型隐含层神经元个数为4。
|
|
表 3 Munsell颜色模型与反射率一阶导数光谱模型比较 Table 3 Comparison between Munsell color model and first derivative reflectance model |
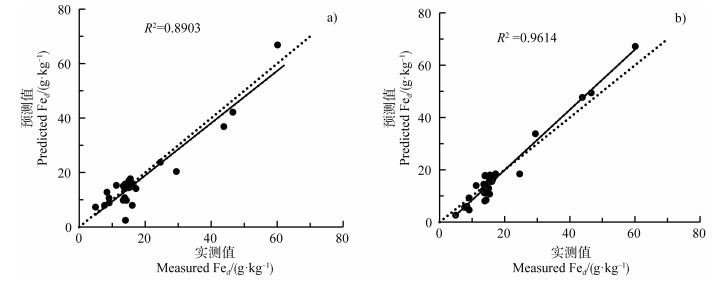
当隐含层神经元个数为4时,R2为0.94,模型拟合度良好;RMSE为4.20,RPD为4.37,模型预测精度高。从预测值与实测值相关分析(图 2a)的1︰1线看,模型中预测值总体低于实测值,偏离实测值较多的样本集中在游离铁含量 > 20 g·kg–1的部分,这可能与游离铁含量 > 20 g·kg–1的高值段的样本数量太少(仅占27.84%)有关,所以模型不能很好地模拟高值段。

|
图 2 游离铁实测值与Munsell颜色(a)、反射率一阶导数光谱(b)模型预测值对比 Fig. 2 Comparison between measured and predicted Fed with the Munsell color model (a) and first derivative reflectance model (b) |
作为对比模型,将400~690 nm土壤可见光波段以10 nm为间隔获取的共计30个反射率一阶导数作为输入层,土壤游离铁含量作为输出层,训练集和测试集与颜色模型相同,数据归一化、反归一化利用mapminmax函数及reverse语句完成。
从表 3可知,由于反射率一阶导数光谱模型输入层神经元远多于Munsell颜色模型,其初始隐含层神经元个数也更大。隐含层神经元最小个数为5时,模型训练集达到预期值;随隐含层神经元个数增加,RMSE主要呈上升趋势,RPD主要呈下降趋势;当隐含层神经元个数过多时,模型拟合度和预测精度降低。因此反射率一阶导数光谱模型隐含层神经元个数选择方式与颜色模型一致,可确定为6。
结合测试集中预测值与实测值相关分析(图 2b)可知,当隐含层神经元个数为6时,R2达0.98,模型拟合度好;RMSE为3.35,RPD为5.99,模型预测精度高。从1:1线可以看出,模型中预测值总体高于实测值,偏离实测值较多的样本仍集中在游离铁含量 > 20 g·kg–1的部分,同样是因为高值段样本太少。
3 讨论 3.1 模型输入数据的选择由于土壤各元素对不同波段反射率不一致,输入的光谱信息成为影响模型拟合度、精度的重要因素之一。如在研究土壤铜含量高光谱反演模型时[25],选择了860 nm波段的一阶微分作为输入数据,得到的模型拟合度为0.721,预测精度达82.3%;在研究山地红壤有机质含量与土壤光谱相关性时[26],发现其原始反射光谱与有机质含量存在连续相关性而选取了原始光谱全波段作为输入层,则显示验证集R2为0.58,RMSE为9.76,RPD为1.56。在土壤氧化铁光谱特征研究中有发现[27],400~2 500 nm波段内反射率与土壤氧化铁含量呈负相关,但相关性较弱,最高值–0.4出现在677 nm处;而目前相当一部分研究[28-30]已经表明400~700 nm可见光波段的反射率一阶导数曲线可指示铁氧化物。
因此本研究选取400~690 nm波段反射率一阶导数与土壤游离铁含量进行Pearson相关分析,如表 4所示,波段内反射率一阶导数与游离铁含量达到显著相关的波段共25个,其中540~570 nm波段相关系数均在0.8以上,而560 nm处相关系数可达到0.903,所以本研究中作为对比建立的反射光谱预测模型拟合度和精度均很高。由表 2可知,土壤Munsell色调、明度、彩度值均与游离铁含量呈显著正相关关系,而土壤颜色是土壤光谱在可见光波段的特殊表现形式,所以据此建立的土壤Munsell颜色预测模型的拟合度、精度也较高。
|
|
表 4 土壤游离铁含量与反射率一阶导数Pearson相关关系 Table 4 Correlation coefficients between Fed and first derivative reflectance |
由表 3结果可知,随输入层神经元个数的增加,隐含层神经元个数最低取值有所上升,但其取值并非越大越好,当隐含层神经元个数过大时,会导致模型拟合度及预测精度的降低。对比两种模型,光谱模型的R2和RPD更大,RMSE更小,其拟合度更好,预测精度更高。可能是由于颜色模型的输入层神经元个数较少,使可训练数据低于后者,导致颜色模型测试集中预测值与实测值间差距较大,但这两种模型均能较好地实现对土壤游离铁的预测。土壤颜色和反射光谱可以反映土壤中针铁矿、赤铁矿等氧化铁矿物含量,土壤氧化铁矿物直接影响到土壤游离铁含量,三者环环相扣,知一可得其二,但土壤颜色受其他土壤成分影响,而其他土壤成分却不能掩盖铁氧化物对土壤反射率的贡献,因此在定量分析铁氧化物含量时,土壤颜色不如反射光谱精确[29,31-32];利用便携式测色仪获取颜色和光谱数据均很便捷,但光谱模型的预测精度较颜色模型高,综合而言,光谱模型更为有利。但颜色数据相对直观,在土壤调查中更易获取,一些历史土壤资料可能缺乏游离铁含量或铁游离度数据,但有颜色信息,对此可以通过颜色预测模型确定土壤游离铁的大致含量,用于系统分类对比研究等方面。
3.3 土壤Munsell颜色与“铁质特性”土壤颜色和游离铁含量均是影响土壤分类的重要性质,在《中国土壤系统分类检索(第三版)》[33]中同时涉及到这两方面的诊断特征为“铁质特性”(Ferric property),该特性需满足以下之一或两个条件:(1)土壤基质色调为5YR或更红;和/或(2)整个B层细土部分DCB浸提游离铁≥14 g·kg–1(游离Fe2O3≥20g·kg–1),或游离铁占全铁的40%或更多。尽管本研究中土壤色调与游离铁含量、铁游离度呈显著正相关,但在统计Munsell色调为5YR或更红的土样的游离铁含量及游离度后发现,此色调段内土壤游离铁含量平均值仅为16.87 g·kg–1,铁游离度平均值为28.44%,无法同时满足以上两个条件。
“铁质特性”的本质是“土壤中游离氧化铁非晶质部分的浸润和赤铁矿、针铁矿、矿微晶的形成,并充分分散于土壤基质内使土壤红化”[33],这表明除游离铁的含量外,其分散程度也能在一定程度上影响土壤颜色。结合前人研究结果可知[34],本研究中较红土壤的游离铁含量低可能是因为其分散程度高。综上所述,Munsell颜色模型的预测精度不如反射光谱模型,除光谱模型的解释变量(即输入变量)更为丰富外,游离铁的分散程度也可能是原因之一。除此之外,由于川中丘陵区土壤Munsell颜色整体色调集中于YR色调,对于颜色相关研究而言稍嫌单调,因此其他土壤如南方典型红壤等是否存在类似结果还需进一步验证。
4 结论川中丘陵区土壤Munsell色调、明度、彩度值均与土壤游离铁含量具有良好的正相关关系,因此可利用土壤Munsell颜色建立BP神经网络模型预测土壤游离铁含量,同时利用反射光谱建立预测模型进行比较。结果表明,颜色模型的隐含层神经元个数为4时,R2为0.94,RMSE为4.20,RPD为4.37;光谱模型的隐含层神经元个数为6时,R2为0.98,RMSE为3.35,RPD为5.99;相比之下,光谱模型拟合度更好,预测精度更高,这可能是由于颜色模型的输入层神经元个数较少以及游离铁分散程度对输入颜色数据的影响。但两者的R2 > 0.9,RPD > 2,模型拟合度、精度均呈较高水平,表明利用土壤Munsell颜色数据预测土壤游离铁含量具有可行性,能为系统分类诊断特性的完善提供一定依据。
| [1] |
Xiong Y. Soil color research (In Chinese)[J]. Geological Review, 1937, 2(1): 5-22. [熊毅. 土壤颜色之研究[J]. 地质论评, 1937, 2(1): 5-22.]
(  0) 0) |
| [2] |
Barouchas P E, Moustakas N K. Precipitation effect on colour characteristics of argillic horizons in well-drained soils developed under Mediterranean climate[J]. International Agrophysics, 2006, 20(2): 85-90.
(  0) 0) |
| [3] |
Barron V, Torrent J. Use of the Kubelka—Munk theory to study the influence of iron oxides on soil colour[J]. Journal of Soil Science, 1986, 37(4): 499-510. DOI:10.1111/j.1365-2389.1986.tb00382.x
(  0) 0) |
| [4] |
Wu Y Z, Tian Q J, Ji J F, et al. Soil remote sensing research theory method and application (In Chinese)[J]. Remote Sensing Information, 2003, 18(1): 40-47. DOI:10.3969/j.issn.1000-3177.2003.01.012 [吴昀昭, 田庆久, 季峻峰, 等. 土壤光学遥感的理论、方法及应用[J]. 遥感信息, 2003, 18(1): 40-47.]
(  0) 0) |
| [5] |
Chen J F. Oxides in soil colloids (In Chinese)[J]. Chinese Journal of Soil Science, 1981, 12(2): 44-49. [陈家坊. 土壤胶体中的氧化物[J]. 土壤通报, 1981, 12(2): 44-49.]
(  0) 0) |
| [6] |
Wei C L, Zhao Y G, Wu D W, et al. Prediction of soil free iron oxide content based on spectral analysis (In Chinese)[J]. Soils, 2014, 46(4): 678-683. [魏昌龙, 赵玉国, 邬登巍, 等. 基于光谱分析的土壤游离铁预测研究[J]. 土壤, 2014, 46(4): 678-683.]
(  0) 0) |
| [7] |
Xiong J F, Zheng G H, Lin C. Estimating soil iron content based on reflectance spectra (In Chinese)[J]. Spectroscopy and Spectral Analysis, 2016, 36(11): 3615-3619. [熊俊峰, 郑光辉, 林晨. 基于反射光谱的土壤铁元素含量估算[J]. 光谱学与光谱分析, 2016, 36(11): 3615-3619.]
(  0) 0) |
| [8] |
Gopal B. Evaluation of topsoil iron oxide from visible spectroscopy[J]. International Journal of Research in Engineering and Technology, 2013, 2(12): 670-673. DOI:10.15623/ijret.2013.0212115
(  0) 0) |
| [9] |
Qin Q R, Qi Y B, Wu J, et al. Estimation of random forest model of soil free iron based on hyperspectral data (In Chinese)[J]. Chinese Journal of Soil Science, 2018, 49(6): 1286-1293. [秦倩如, 齐雁冰, 吴娟, 等. 基于高光谱的土壤游离铁随机森林模型估算研究[J]. 土壤通报, 2018, 49(6): 1286-1293.]
(  0) 0) |
| [10] |
Gong Z T, Chen Z C, Luo G B, et al. Reference of Chinese Soil Taxonomy (In Chinese)[J]. Soils, 1999, 31(2): 57-63. [龚子同, 陈志诚, 骆国保, 等. 中国土壤系统分类参比[J]. 土壤, 1999, 31(2): 57-63.]
(  0) 0) |
| [11] |
Mauk L. Billmeyer and Saltzman's principles of color technology[J]. Color Research & Application, 2001, 26(4): 322-324.
(  0) 0) |
| [12] |
Kirillova N P, Vodyanitskii Y N, Sileva T M. Conversion of soil color parameters from the Munsell system to the CIE-L*a*b* system[J]. Eurasian Soil Science, 2015, 48(5): 468-475. DOI:10.1134/S1064229315050026
(  0) 0) |
| [13] |
Wu C W, Yang Y, Xia J X. Rapid method for estimating organic matter of black soil based on RGB (In Chinese)[J]. Chinese Journal of Soil Science, 2016, 47(4): 853-859. [吴才武, 杨越, 夏建新. 基于RGB的黑土有机质快速测定方法研究[J]. 土壤通报, 2016, 47(4): 853-859.]
(  0) 0) |
| [14] |
Islam K, McBratney A B, Singh B. Estimation of soil colour from visible reflectance spectra[J]. Super Soil 2004:3rd Australian New Zealand Soils Conference, Sydney, 2004.
(  0) 0) |
| [15] |
Levin N, BenâDor E, Singer A. A digital camera as a tool to measure colour indices and related properties of sandy soils in semi-arid environments[J]. International Journal of Remote Sensing, 2005, 26(24): 5475-5492. DOI:10.1080/01431160500099444
(  0) 0) |
| [16] |
Chen J K, Yuan D G, Yan Z M, et al. Comparison between colorimeter and new standard soil colour chart of china in determining Munsell color of soils-A case study of central Sichuan hilly region (In Chinese)[J]. Acta Pedologica Sinica, 2019, 56(1): 78-89. [陈剑科, 袁大刚, 晏昭敏, 等. 测色仪与中国标准土壤色卡测定土壤颜色比较——以川中丘陵区为例[J]. 土壤学报, 2019, 56(1): 78-89.]
(  0) 0) |
| [17] |
Tian G L, Tang S J. Contents and distribution of mineral-forming elements in purple soils from the Sichuan Basin (In Chinese)[J]. Geochimica, 1991, 20(1): 70-78. DOI:10.3321/j.issn:0379-1726.1991.01.009 [田光龙, 唐时嘉. 四川盆地紫色土矿质元素的含量与分布[J]. 地球化学, 1991, 20(1): 70-78.]
(  0) 0) |
| [18] |
Liu Y, Ding X, Liu H J, et al. Quantitative analysis of reflectance spectrum of black soil as affected by soil moisture for prediction of soil moisture in black soil (In Chinese)[J]. Acta Pedologica Sinica, 2014, 51(5): 1021-1026. [刘洋, 丁潇, 刘焕军, 等. 黑土土壤水分反射光谱特征定量分析与预测[J]. 土壤学报, 2014, 51(5): 1021-1026.]
(  0) 0) |
| [19] |
Zhang G L, Gong Z T. Soil survey laboratory methods (In Chinese). Beijing: Science Press, 2012. [张甘霖, 龚子同. 土壤调查实验室分析方法[M]. 北京: 科学出版社, 2012.]
(  0) 0) |
| [20] |
Viscarra Rossel R A, Minasny B, Roudier P, et al. Colour space models for soil science[J]. Geoderma, 2006, 133(3/4): 320-337.
(  0) 0) |
| [21] |
Ling C X, Liu H, Ju H B, et al. Identifying typical wetland vegetation types based on imaging spectrometer data: A case study in Dongting lake wetland area (In Chinese)[J]. Journal of Northwest Forestry University, 2018, 33(3): 208-213. DOI:10.3969/j.issn.1001-7461.2018.03.32 [凌成星, 刘华, 鞠洪波, 等. 基于地面成像光谱数据特征的湿地典型植被类型识别研究——以东洞庭湖核心区湿地为例[J]. 西北林学院学报, 2018, 33(3): 208-213.]
(  0) 0) |
| [22] |
Wang X C. Matlab neural network analysis of 43 cases (In Chinese). Beijing: Beihang University Press, 2013. [王小川. MATLAB神经网络43个案例分析[M]. 北京: 北京航空航天大学出版社, 2013.]
(  0) 0) |
| [23] |
Lin J, Chen X M, Zhang Y, et al. Simulation of soil moisture dynamics based on the BP neural network in the typical farmland of Tai Lake region (In Chinese)[J]. Journal of Nanjing Agricultural University, 2012, 35(4): 144-144. [林洁, 陈效民, 张勇, 等. 基于BP神经网络的太湖典型农田土壤水分动态模拟[J]. 南京农业大学学报, 2012, 35(4): 144-144.]
(  0) 0) |
| [24] |
Summers D, Lewis M, Ostendorf B, et al. Visible near-infrared reflectance spectroscopy as a predictive indicator of soil properties[J]. Ecological Indicators, 2011, 11(1): 123-131. DOI:10.1016/j.ecolind.2009.05.001
(  0) 0) |
| [25] |
Guo Y K, Liu N, Liu L, et al. Hyper-spectral inversion of soil Cu content based on BP neural network model (In Chinese)[J]. Science of Surveying and Mapping, 2018, 43(1): 135-139, 152. [郭云开, 刘宁, 刘磊, 等. 土壤Cu含量高光谱反演的BP神经网络模型[J]. 测绘科学, 2018, 43(1): 135-139, 152.]
(  0) 0) |
| [26] |
Xie W, Zhao X M, Guo X, et al. Spectrum based estimation of the content of soil organic matters in mountain red soil using RBF combination model (In Chinese)[J]. Scientia Silvae Sinicae, 2018, 54(6): 16-23. [谢文, 赵小敏, 郭熙, 等. 基于RBF组合模型的山地红壤有机质含量光谱估测[J]. 林业科学, 2018, 54(6): 16-23.]
(  0) 0) |
| [27] |
He T, Wang J, Cheng Y, et al. Study on spectral features of soil Fe2O3 (In Chinese)[J]. Geography and Geo-Information Science, 2006, 22(2): 30-34. DOI:10.3969/j.issn.1672-0504.2006.02.008 [何挺, 王静, 程烨, 等. 土壤氧化铁光谱特征研究[J]. 地理与地理信息科学, 2006, 22(2): 30-34.]
(  0) 0) |
| [28] |
Yuan X K, Li X S, Han Z Y, et al. Study on the application of quantitative analysis of iron oxides by diffuse reflectance spectroscopy in the loess of South China (In Chinese)[J]. Geological Journal of China Universities, 2017, 23(2): 350-358. [苑晓康, 李徐生, 韩志勇, 等. 基于漫反射光谱的铁氧化物定量分析在南方黄土中的适用性研究[J]. 高校地质学报, 2017, 23(2): 350-358.]
(  0) 0) |
| [29] |
Deaton B C, Balsam W L. Visible spectroscopy; a rapid method for determining hematite and goethite concentration in geological materials[J]. Journal of Sedimentary Research, 1991, 61(4): 628-632. DOI:10.1306/D4267794-2B26-11D7-8648000102C1865D
(  0) 0) |
| [30] |
Chen J, Ji J F, Balsam W, et al. Characterization of the Chinese loess-paleosol stratigraphy by whiteness measurement[J]. Palaeogeography, Palaeoclimatology, Palaeoecology, 2002, 183(3/4): 287-297.
(  0) 0) |
| [31] |
Ji J F, Balsam W, Chen J, et al. Rapid and quantitative measurement of hematite and goethite in the Chinese loess-paleosol sequence by diffuse reflectance spectroscopy[J]. Clays and Clay Minerals, 2002, 50(2): 208-216. DOI:10.1346/000986002760832801
(  0) 0) |
| [32] |
Hu X F, Du Y, Guan C L, et al. Color variations of the Quaternary Red Clay in Southern China and its paleoclimatic implications[J]. Sedimentary Geology, 2014, 303: 15-25. DOI:10.1016/j.sedgeo.2014.01.006
(  0) 0) |
| [33] |
Chinese Soil Taxonomy Research Group, Institute of Soil Science, Chinese Academy of Sciences, Cooperative Research Group on Chinese Soil Taxonomy. Keys to Chinese Soil Taxonomy (In Chinese). 3rd ed[M]. Hefei: University of Science and Technology of China Press, 2001. [中国科学院南京土壤研究所土壤系统分类课题组, 中国土壤系统分类课题研究协作组. 中国土壤系统分类检索[M]. 第3版. 合肥: 中国科学技术大学出版社, 2001.]
(  0) 0) |
| [34] |
Schwertmann U. Relations between iron oxides, soil color, and soil formation[M]//Soil Color. Madison, WI, USA: Soil Science Society of America, 2015: 51-69.
(  0) 0) |
 2021, Vol. 58


