2. 中国科学院大学, 北京 100049;
3. 河海大学农业科学与工程学院, 南京 210098;
4. 中国农业大学土地科学与技术学院, 北京 100193
2. University of Chinese Academy of Sciences, Beijing 100049, China;
3. College of Agricultural Science and Engineering, Hohai University, Nanjing 210098, China;
4. College of Land Science and Technology, China Agricultural University, Beijing 100193, China
土壤有机碳(SOC)矿化指SOC分解产生CO2的过程,认识SOC的矿化规律对于阐明土壤碳库的周转过程并对其进行有效调节具有十分重要的作用[1]。土壤有机碳矿化过程受诸多因素的影响,包括温度条件、水分状况、土壤质地、通气性等。土壤结构决定了土壤的水气传输和微生物活动,因而对SOC矿化有重要影响[2-3]。
通过室内培养法测定SOC矿化时,一般采用过筛后的松散土样进行培养[4]。松散土样与实际土壤的结构差异很大,通过培养松散土样测定的SOC矿化量与田间真实情况的关系尚不明确[4]。有研究表明,土样过2 mm或4 mm筛后再按照田间实际容重填装的土柱与原状土的SOC矿化量差异不显著[5-6],因此,可以通过填装土柱的方法获得接近田间状态的土壤样品,通过比较松散土样和填装土柱的SOC矿化量来判断松散土样的培养结果是否可以代表田间SOC的矿化潜力,从而更加准确量化SOC的周转过程。
填装土柱时,填装的紧实程度会改变土壤的孔隙结构,因此可能会影响SOC的矿化过程。一些学者发现,SOC矿化量随紧实程度增加逐渐降低,且SOC矿化量与容重之间存在显著的负相关关系,并认为这可能是紧实程度增加使土壤的通气性变差,从而抑制了微生物对SOC的分解导致的[7-8]。而De Neve和Hofman[9]则发现当容重小于1.6 g·cm–3时,紧实程度增加对SOC矿化量没有显著影响;直到容重增加到1.6 g·cm–3时,SOC矿化量才有较大幅度地降低。因此,紧实程度对SOC矿化的影响并没有统一的结论,需要进一步研究。本研究首先比较松散土样与填装土柱之间SOC矿化的差异,然后分析紧实程度对填装土柱孔隙结构及SOC矿化的影响,并进一步分析SOC矿化与孔隙结构之间的关系,研究结果将会加深对SOC矿化与土壤孔隙结构之间关系的认识。
1 材料与方法 1.1 供试材料土壤样品采集于江西省鹰潭市余江县中国科学院红壤生态实验站(28°15′20″N,116°55′30″E)的长期定位试验田。该区属于中亚热带湿润季风气候,年均温度17.6℃,多年平均降雨量1 795 mm。土壤为第四纪红黏土母质发育的红壤(黏化湿润富铁土),黏粒、粉粒和砂粒的含量分别为36.3%、42.5%和21.2%。长期定位试验开始于2002年,本研究选择3个施肥处理,分别为:不施肥(Control);施低量有机肥(LM,N 150 kg·hm–2·a–1)和施高量有机肥(HM,N 600 kg·hm–2·a–1)。有机肥为猪粪,来自试验站附近的养殖场,平均pH为7.72,全氮32.9 g·kg–1(干基,下同),全钾14.0 g·kg–1,全磷20.2 g·kg–1,全碳306.5 g·kg–1。每个施肥处理设置3次重复,以顺序区组排列,小区大小为2 m × 2 m。种植作物为玉米,品种为苏玉24。每年4月中旬播种,7月下旬玉米收获,之后至次年4月土地休闲。种植密度为每小区20株,相当于50 000株·hm–2。于2019年7月玉米收获后采集0~20 cm的表层土样,每个小区随机采集3个点混合为一个样品,室温下风干,挑去根系、石块等。将同一施肥处理土样均匀混合,过2 mm筛,分别称为Control、LM和HM土壤,供试土壤的基本性质见表 1[10]。
|
|
表 1 供试土壤的基本理化性质 Table 1 Soil physicochemical properties under three fertilization treatments |
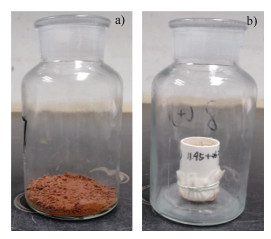
培养试验一选用Control、LM和HM三种施肥处理的土壤,设置松散土样和填装土柱两个处理,每个处理设置3个重复,比较松散土样和填装土柱SOC矿化的差异。松散土样处理:取20.0 g过2 mm筛的土样加入500 mL培养瓶中,松散铺于瓶底(图 1a)。填装土柱处理:将过2 mm筛的土样分层填装至内径2.9 cm、高5 cm的聚氯乙烯(Polyvinyl chloride,PVC)环刀中,填装高度4 cm,填装的紧实程度参考田间测定的容重数据,设置为1.3 g·cm–3(图 1b)。

|
图 1 松散土样(a)与填装土柱处理(b)示意图 Fig. 1 Schematic diagram of loose soil samples(a)and repacked soil columns(b) |
试验一采用土壤呼吸法测定SOC矿化量。将土样含水量调节为田间持水量的75%,然后置于22℃的培养箱中避光培养57 d,填装土柱培养前需在4℃的培养箱中水平衡3 d。分别在培养的第1、2、4、8、11、15、22、29、37、43、50和57天时采集气体。采气前,先将培养瓶置于22℃的室温下通风20 min,然后用硅橡胶塞密封瓶口。向培养瓶中注入20 mL新鲜空气,混合均匀后,从中抽取20 mL气体注入真空集气瓶;培养6 h后,再次采气。采气结束后,去除硅橡胶塞,用保鲜膜裹住瓶口并扎孔。采集的气体利用气相色谱(Gas chromatography,GC. Agilent 7890A,Agilent Technologies,Santa Clara,CA,USA)测定CO2浓度,进而计算CO2的产生速率(F,mg·kg–1·h–1)以及累积产生量。CO2产生速率的计算公式为[11]:
| $ F = \frac{{\rho \times \Delta C \times V \times 273}}{{W \times \Delta t \times T}} $ | (1) |
式中,ρ为标准状态下CO2的密度,0.536 kg·m–3;∆C为一天内两次采气的CO2的浓度差,单位为g·m–3;V为培养瓶中有效空间体积,单位为m3;W为烘干土质量,单位为kg;∆t为一天内两次采气的时间间隔,单位为h;T为培养温度,单位为K。CO2累积产生量为相邻两次测定气体的CO2产生速率的平均值与间隔时间乘积的累加值。
培养试验二选取HM土壤,设置BD1.1、BD1.3、BD1.5、BD1.7四个紧实程度处理,容重分别为1.1、1.3、1.5和1.7 g·cm–3,每个处理设置3个重复,分析不同紧实程度对SOC矿化的影响。土柱填装方式同培养试验一。
试验二采用碱液吸收法测定SOC矿化量。同样地,将土柱含水量调节为田间持水量的75%(0.19 g·g–1),培养前放入4℃的培养箱中水平衡3 d。水平衡结束后,将土柱放入500 mL培养瓶中,然后将盛有5 mL 0.5 mol·L–1 NaOH溶液的特制吸收瓶小心地置于培养瓶内,加盖密封,放置在22℃的恒温培养箱中,黑暗条件下培养28 d。在培养的第1、3、5、7、9、14、21和28天取出吸收瓶,除第28天外,其余时间均换上新的吸收液继续培养。将取出的吸收瓶中的溶液完全洗入三角瓶中,加入1 mol·L–1的BaCl2溶液2 mL和2滴酚酞指示剂,用标准酸(约0.03 mol·L–1 HCl)滴定直至红色消失。通过HCl消耗量计算CO2释放量,并进一步计算出SOC矿化速率及累积矿化量。CO2释放量(mg·kg–1)的计算公式为:
| $ {\text{C}}{{\text{O}}_{\text{2}}} = {1 \mathord{\left/ {\vphantom {1 2}} \right. } 2} \times {C_{{\text{HCI}}}} \times ({V_0} - V) \times {{12} \mathord{\left/ {\vphantom {{12} m}} \right. } m} $ | (2) |
式中,CHCl为标准酸的浓度,约0.03 mol·L–1;V0为空白消耗盐酸的体积,单位为mL;V为样品消耗盐酸的体积,单位为mL;m为烘干土的质量,单位为kg。
1.3 CT扫描与图像处理培养试验二结束后,利用X射线显微CT(Phoenix Nanotom X-ray μCT,GE,Sensing and Inspection Technologies,GmbH,Wunstorf,Germany)扫描不同容重的填装土柱。扫描电压为90 kV,电流为90 μA,曝光时间为1.25 s。样品在样品台水平匀速旋转360°,在此过程中共采集1 201幅图像,空间分辨率为16 μm。利用Datos|x2 Rec软件进行图像重建,然后利用VG Studio Max 2.2软件生成2 302张8位灰度图像,存储为tiff格式。利用ImageJ软件进行图像处理和分析,首先进行高斯滤波降低图像的噪声。为减少边际效应和光束硬化引起的伪影,选择图像中心区域作为感兴趣区域(Region of interest,ROI)。ROI的大小为1 600 × 1 600 × 1 500体元,实际大小为25.6 mm × 25.6 mm × 24 mm。利用目视法确定阈值,将图像分割为土壤基质和孔隙两部分。由于分辨率的限制,从图像中获取的孔隙均为大于分辨率(16 μm)的孔隙,本文中称为大孔隙(Macropore)。ROI中大孔隙体积占ROI体积的比例称为大孔隙度(Macro-porosity)[12]。
1.4 数据分析与统计填装土柱总孔隙度(Total porosity,TP)根据式(3)计算:
| $ \operatorname{TP}(\%)=\left( {1 - \frac{{{\rho _b}}}{{{\rho _s}}}} \right) \times 100\% $ | (3) |
式中,ρb表示土壤容重,单位为g·cm–3;ρs表示土粒密度,值选用2.65 g·cm–3[13]。
充水孔隙度(Water-filled pore space,WFPS)根据式(4)计算:
| $ {\text{WFPS}(\% ) = }{\text{WFPS}(\% ) = }\frac{{{\theta _v}}}{{TP}} \times 100\% $ | (4) |
式中,θv表示土壤容积含水量,单位为cm·cm–3。
充气孔隙度(Air-filled pore space,AFPS)根据式(5)计算:
| $ \operatorname{AFPS}(\%)=100 \%-\text { WFPS } $ | (5) |
利用SPSS 21.0(SPSS Inc.,Chicago,IL,USA)进行数据分析。采用双因素方差分析(Two-way ANOVA)考察施肥处理和样品状态以及它们的交互作用对SOC累积矿化量的影响;利用T检验(T-test)比较松散土样和填装土柱之间的差异性;利用单因素方差分析(One-way ANOVA)检验不同施肥处理以及不同紧实程度之间的差异性,采用最小差异显著法(Least Significant Difference,LSD)进行多重比较,显著性水平为0.05。利用回归分析建立SOC矿化量和总孔隙度、大孔隙度、充水孔隙度和充气孔隙度之间的关系[14]。数据的正态性检验采用夏皮罗-威尔克检验(Shapiro-Wilk test),方差齐性检验采用列文检验(Levene-test)。
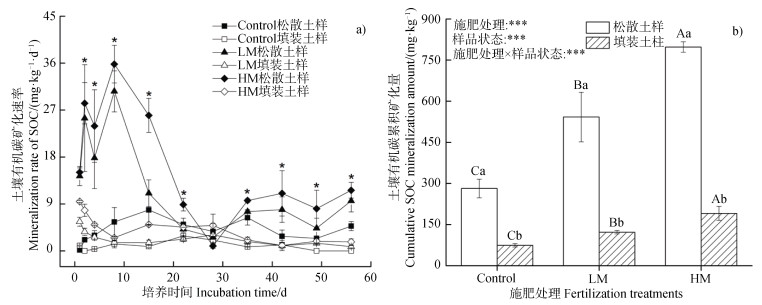
2 结果 2.1 松散土样和填装土柱的SOC矿化速率和累积矿化量由SOC矿化速率变化曲线(图 2a)可以看出,LM和HM松散土样的矿化速率波动较大,其在培养初期(第15天之前)较高,峰值出现在第8天,分别为30.6 mg·kg–1·d–1和35.8 mg·kg–1·d–1;之后,矿化速率快速下降并在第29天出现低谷;第37天之后矿化速率趋于稳定。Control松散土样的矿化速率显著低于LM和HM松散土样(P < 0.05),且相较于二者而言,其矿化速率波动较小,峰值出现在第15天(7.86 mg·kg–1·d–1),同样地,在第29天降至低谷(图 2a)。填装土柱的矿化速率在培养第1天时达到峰值(1.3~9.5 mg·kg–1·d–1),之后逐渐下降,LM和HM填装土柱的矿化速率显著高于Control填装土柱(P < 0.05)(图 2a)。

|
注:“*”表示在某一采样节点上,在同一施肥处理的土壤中,松散土样与填装土柱之间差异显著(P < 0.05)。“***”表示效应极显著,显著性水平为0.001。不同小写字母表示同一施肥处理不同样品状态之间的差异显著(P < 0.01),不同大写字母表示同一样品状态不同施肥处理之间的差异显著(P < 0.01)。 Note: "*" indicates the significant difference between loose soil samples and repacked soil columns on a specific sampling date under the same fertilization treatments(P < 0.05). "***" represents a significant effect, and the level of significance is 0.001. Different lowercase letters indicate the significant difference between loose soil samples and repacked soil columns(P < 0.01);Different uppercase letters indicate the significant difference among fertilization treatments(P < 0.01). 图 2 不同施肥处理下松散土样和填装土柱的有机碳矿化速率和累积矿化量 Fig. 2 SOC mineralization rate and cumulative SOC mineralization amount of loose soil samples and repacked soil columns under different fertilization treatments |
在同一施肥处理的土壤中,除第29天外,其他采样点均表现为松散土样的SOC矿化速率显著高于填装土柱(P < 0.05)(图 2a)。培养结束时(第57天),样品结构状态对SOC累积矿化量有极显著的影响,Control、LM和HM松散土样的SOC累积矿化量较填装土柱分别高279%、345%和319%(P < 0.01)(图 2b)。从数值上看,3种施肥处理下松散土样的SOC累积矿化量较填装土柱增加的比例差异较小。长期施用有机肥显著增加了SOC累积矿化量(P < 0.001)。培养结束时,LM和HM松散土样的SOC累积矿化量较Control松散土样分别增加了92%和183%(P < 0.01),填装土柱的有机碳累积矿化量分别增加了64%和156%(P < 0.01)(图 2b)。
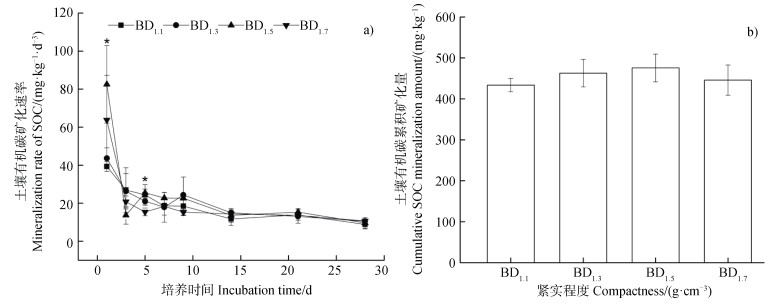
2.2 紧实程度对SOC矿化速率和累积矿化量的影响SOC矿化速率在培养第1天最高,约为39.3~63.7 mg·kg–1·d–1;之后,矿化速率逐渐降低,并在培养14 d后基本稳定(图 3a)。培养第1天和第5天时,紧实程度对SOC矿化速率有显著影响(P < 0.05)。其中,第1天时,BD1.5的矿化速率显著高于BD1.1和BD1.3(P < 0.01);第5天时,BD1.7显著低于其他处理(P < 0.05)。除第1天和第5天外,其他采样时间点不同紧实程度之间没有显著差异(P > 0.05)(图 3a)。培养结束时,BD1.5的有机碳累积矿化量最高,但各处理之间不存在显著差异(P > 0.05)(图 3b)。

|
注:“*”表示紧实程度对SOC矿化速率有显著影响(P < 0.05)。 Note: "*" represents that there was a significant effect of compactness on SOC mineralization rate(P < 0.05). 图 3 不同紧实程度填装土柱的有机碳矿化速率(a)和累积矿化量(b) Fig. 3 SOC mineralization rate(a)and cumulative SOC mineralization amount(b)of the repacked soil columns with different bulk densities |
填装土柱的总孔隙度随紧实程度增加而降低,相较于BD1.1而言,BD1.3、BD1.5和BD1.7的总孔隙度分别降低了12.9%、14.8%和17.4%(表 2)。土壤大孔隙度呈现出与总孔隙度类似的趋势。随着紧实程度增加,土壤中的大孔隙数量明显减少(图 4),紧实程度增加使大孔隙度降低了18.7% ~ 88.5%(表 2)。此外,在紧实程度增加过程中,土壤充气孔隙度(AFPS)从63.6%下降至8.2%,而土壤充水孔隙度(WFPS)从36.4%增至91.8%(表 2)。
|
|
表 2 不同紧实程度填装土柱的总孔隙度、大孔隙度、充水孔隙度及充气孔隙度 Table 2 Total porosity, macro-porosity, water-filled pore space and air-filled pore space of the repacked soil columns with different bulk densities |

|
注:图中白色区域为土壤孔隙,黑色区域为土壤基质。 Note: The white areas are soil pores, and the black region is the soil matrix. 图 4 不同紧实程度填装土柱的二维结构 Fig. 4 2-D structure of the repacked soil columns with different bulk densities |
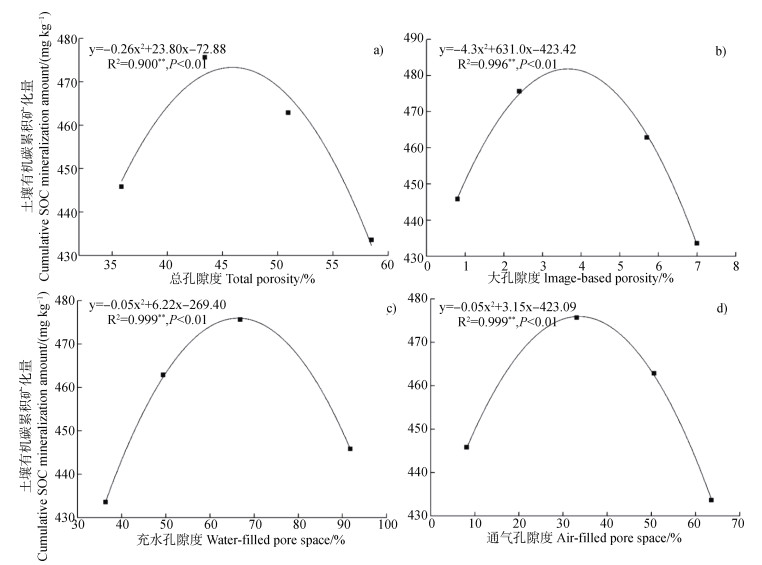
SOC矿化量与总孔隙度、大孔隙度、充水孔隙度以及充气孔隙度之间存在显著的非线性关系(P < 0.01,图 5)。当总孔隙度低于46%时,SOC矿化量随总孔隙度增加而增加;但当总孔隙度高于46%时,SOC矿化量随孔隙度增加而降低。SOC矿化量与大孔隙度之间的关系呈现出类似的规律,其拐点值为3.7%。此外,在WFPS增加的过程中,SOC矿化量持续增加,当WFPS约为66%时,SOC矿化量达到最高,之后,SOC矿化量逐渐降低。与之对应,AFPS约为34%时,SOC矿化量最高。

|
图 5 土壤有机碳累积矿化量与总孔隙度、大孔隙度、充水孔隙度及充气孔隙度之间的关系 Fig. 5 Relationships between cumulative SOC mineralization amount and total porosity, macro-porosity, water-filled pore space and air-filled pore space |
对于松散土样而言,其矿化速率在第8天时达到峰值(Control松散土样在第15天),之后持续下降,这是因为在有机质分解过程中,微生物优先利用易分解的活性组分,如糖类、蛋白质等,随着活性组分减少,其分解速率降低[15]。第29天之后,矿化速率增加,这可能是因为土壤中不同类型有机物的降解性不同[16]。Control松散土样因其有机碳含量较低(表 1),在整个培养过程中,相对LM和HM松散土样而言速率较低且波动较小(图 2a)。填装土柱的矿化速率也是表现为培养初期较高,之后逐渐降低,但相较于松散土样而言波动较小。
统计结果显示,在3种施肥处理的土壤中,除培养第29天外,其他时间均表现为松散土样的SOC矿化速率显著高于填装土柱(P < 0.05)(图 2a)。此外,培养结束时(第57天),各施肥处理下松散土的有机碳累积矿化量约为填装土柱的4倍(P < 0.05)(图 2b)。这一结果与陆志敏等[4]的结果一致,他们发现经过25 d的培养后,松散土样的CO2总释放量约是原状土的3倍~7倍。这可能是因为在松散状态下,SOC的暴露程度较大,微生物接触有机底物不受限制;此外,土壤的通气性也处于最佳状态,从而导致松散土样的有机碳矿化量较高。而将土样填装到PVC环刀中后,限制了微生物接触有机底物,而且影响了土壤的通气性,导致填装土柱的有机碳矿化量显著降低(P < 0.05)(图 2a、图 2b)。以往的研究表明,土样过2 mm或4 mm筛后再按照田间实际容重填装的土柱与原状土的有机碳矿化量没有显著差异[5-6],因此,本研究结果说明通过培养松散土样测定SOC矿化会高估田间SOC矿化的潜力,通过培养填装土柱可提高室内培养SOC矿化潜力估计的准确性。
培养结束时,无论在松散土样或填装土柱中,LM和HM土壤的有机碳累积矿化量均显著高于Control土壤(P < 0.05)(图 2b)。相较于Control土壤而言,LM和HM土壤的有机碳累积矿化量分别增加了64% ~ 92%和156% ~ 183%(P < 0.05)(图 2b)。这是因为长期施用有机肥增加了SOC含量(表 1),增加了微生物碳源和微生物活性,从而促进了微生物对SOC的分解[15-16]。
3.2 紧实程度对SOC矿化的影响对于填装土柱而言,紧实程度是影响其SOC矿化的一个重要因素。根据培养试验一的结果,对于不同施肥处理的土壤,培养期内松散土样的SOC累积矿化量相对于填装土样的增幅分别为278%、345%和319%,其差异较小。因此在培养实验二中,仅选用HM土壤为试验对象,通过填装土柱,分析紧实程度对SOC矿化的影响。培养28 d后,不同紧实程度处理之间SOC累积矿化量没有显著差异(P > 0.05),但BD1.5的SOC累积矿化量数量上高于其他3个处理(图 3b)。而且,培养第1天时,BD1.5的SOC矿化速率显著高于BD1.1和BD1.3(P < 0.05)(图 3a)。这与李典鹏等[17]的研究结果类似,他们发现随着紧实程度增加,SOC矿化量呈现出先增加后降低的趋势,容重为1.45 g·cm–3时,SOC矿化量最高。这可能是因为紧实程度适当增加使微生物接触到的有机物增加[18],提高了土壤微生物生物量碳氮、酶活性以及微生物功能多样性等[17,19-20],从而促进了SOC矿化。然而,也有不少研究发现,SOC矿化量随容重增加显著降低,并认为这是由于紧实程度增加导致土壤通气性变差而降低土壤微生物活性导致的[7-8,18]。紧实程度对土壤微生物的影响主要取决于其对土壤通气性的影响[20],而在不同质地[18,21]、不同含水量[22]以及是否添加外源有机物[7]的土壤上,紧实程度增加对土壤通气性的影响不同,因此对SOC矿化量的影响可能表现出不一致的规律。
紧实程度对土壤通气性的影响源于其对孔隙结构的影响。当容重从1.1 g·cm–3增至1.7g·cm–3时,土壤总孔隙度降低了15%左右,而大孔隙(> 16 μm)度降低了18.7%~88.5%(表 2)。大孔隙度的降低幅度高于总孔隙度,这说明容重增加主要减少了大孔隙[23-24]。紧实程度增加导致土壤总孔隙度降低,但因培养时的含水量相近,因此WFPS增加,AFPS降低。本研究中,随着紧实程度增加,WFPS增加了35.7%~152.2%,AFPS降低了20.4%~75.1%(表 2)。当总孔隙度或大孔隙度较高(分别为 > 46%和 > 3.7%)时,SOC矿化量随总孔隙度或大孔隙度的降低而增加(图 5)。这可能是因为在总孔隙度或大孔隙度较高的情况下,土壤中通气条件较好,影响有机碳矿化的主要因素是微生物接触有机底物的可能性和水分状况,而总孔隙度或大孔隙度适当降低能使土壤结构更加紧密,使微生物接触到的有机底物更多,同时WFPS增加,土壤水、气条件没有成为限制因素,导致有机物的分解速率加快[17-18,25-27]。而当土壤中总孔隙度或大孔隙度较低(分别为 < 46%和 < 3.7%)时,WFPS增加到较大值(> 66%),土壤的通气性严重受限,限制CO2及O2的扩散,导致微生物活性降低,降低有机物的分解速率[26]。与以往的研究[7-8]不同,我们发现SOC矿化量与总孔隙度或大孔隙度之间的关系是非线性的,在总孔隙度或大孔隙度变化过程中,存在一个拐点(分别为46%和3.7%),拐点前后土壤总孔隙度或大孔隙度与SOC的关系趋势相反。同时,本研究发现当WFPS约为66%时,SOC矿化量最高,与Ding等[26]的研究结果(WFPS为70%时,SOC矿化量最高)类似,这说明该水/气条件下微生物活性最高,有利于SOC分解。
4 结论土样培养时的结构状态对SOC矿化有极显著的影响,松散土样的SOC矿化量约是填装土柱的4倍,因此土样过筛后分散状态下培养可能会高估田间SOC矿化的潜力。填装土柱的紧实程度影响SOC矿化,SOC矿化量随紧实程度增加呈先增加后降低的趋势,容重为1.5 g·cm–3时SOC矿化量最高。SOC矿化量随紧实程度的增加与土壤孔隙的改变有关,其与孔隙度之间存在显著的非线性关系。当孔隙度较低时(总孔隙度和大孔隙度分别为 < 46%和 < 3.7%时),SOC矿化量随孔隙度增加而增加;反之,SOC矿化量随二者增加而降低。此外,SOC矿化量随WFPS增加先增加后降低,当WFPS约为66%时,SOC矿化量最高。
| [1] |
Lal R. Soil carbon sequestration impacts on global climate change and food security[J]. Science, 2004, 304(5677): 1623-1627. DOI:10.1126/science.1097396
(  0) 0) |
| [2] |
Zhang W J, Li S Y, Xu Y D, et al. Advances in research on relationships between soil pore structure and soil miocroenvironment and organic carbon turnover (In Chinese)[J]. Journal of Soil and Water Conservation, 2019, 33(4): 1-9. [张维俊, 李双异, 徐英德, 等. 土壤孔隙结构与土壤微环境和有机碳周转关系的研究进展[J]. 水土保持学报, 2019, 33(4): 1-9.]
(  0) 0) |
| [3] |
Kravchenko A N, Guber A K. Soil pores and their contributions to soil carbon processes[J]. Geoderma, 2017, 287: 31-39. DOI:10.1016/j.geoderma.2016.06.027
(  0) 0) |
| [4] |
Lu Z M, Pan G X, Zheng J F, et al. Change in CO2 production potential by soil respiration from a paddy soil under aerobic incubation by using differently disturbed samples (In Chinese)[J]. Ecology and Environment, 2007, 16(3): 987-993. DOI:10.3969/j.issn.1674-5906.2007.03.056 [陆志敏, 潘根兴, 郑聚锋, 等. 不同状态样品培养下太湖地区黄泥土好气呼吸与CO2产生潜力[J]. 生态环境, 2007, 16(3): 987-993.]
(  0) 0) |
| [5] |
Thomson B C, Ostle N J, McNamara N P, et al. Effects of sieving, drying and rewetting upon soil bacterial community structure and respiration rates[J]. Journal of Microbiological Methods, 2010, 83(1): 69-73. DOI:10.1016/j.mimet.2010.07.021
(  0) 0) |
| [6] |
Adekanmbi A A, Shaw L J, Sizmur T. Effect of sieving on ex situ soil respiration of soils from three land use types[J]. Journal of Soil Science and Plant Nutrition, 2020, 20(3): 912-916. DOI:10.1007/s42729-020-00177-2
(  0) 0) |
| [7] |
Tan X, Chang S X. Soil compaction and forest litter amendment affect carbon and net nitrogen mineralization in a boreal forest soil[J]. Soil & Tillage Research, 2007, 93(1): 77-86.
(  0) 0) |
| [8] |
Chen X W, Yang J M, Liang A Z, et al. Effects of soil compaction and tillage practices on carbon dioxide efflux in northeast China: Evidence from an incubation study[J]. Polish Journal of Environmental Studies, 2016, 25(4): 1769-1776. DOI:10.15244/pjoes/62344
(  0) 0) |
| [9] |
De Neve S, Hofman G. Influence of soil compaction on carbon and nitrogen mineralization of soil organic matter and crop residues[J]. Biology and Fertility of Soils, 2000, 30(5/6): 544-549.
(  0) 0) |
| [10] |
Jiang Y J, Zhou H, Chen L J, et al. Nematodes and microorganisms interactively stimulate soil organic carbon turnover in the macroaggregates[J]. Frontiers in Microbiology, 2018, 9: 2803. DOI:10.3389/fmicb.2018.02803
(  0) 0) |
| [11] |
Hu R G, Hatano R, Kusa K, et al. Soil respiration and net ecosystem production in an onion field in Central Hokkaido, Japan[J]. Soil Science and Plant Nutrition, 2004, 50(1): 27-33. DOI:10.1080/00380768.2004.10408449
(  0) 0) |
| [12] |
Zhou H, Fang H, Mooney S J, et al. Effects of long-term inorganic and organic fertilizations on the soil micro and macro structures of rice paddies[J]. Geoderma, 2016, 266: 66-74. DOI:10.1016/j.geoderma.2015.12.007
(  0) 0) |
| [13] |
尼尔·布雷迪, 雷·韦尔. 土壤学与生活[M]. 李保国, 徐建明, 等译. 北京: 科学出版社, 2019: 142. Nyle C B, Ray R W. The nature and properties of soils Nature and properties of soils[M]. Beijing: Science Press, 2019: 142. (  0) 0) |
| [14] |
Pengthamkeerati P, Motavalli P P, Kremer R J. Soil microbial activity and functional diversity changed by compaction, poultry litter and cropping in a claypan soil[J]. Applied Soil Ecology, 2011, 48(1): 71-80. DOI:10.1016/j.apsoil.2011.01.005
(  0) 0) |
| [15] |
钱海燕. 长期施用有机肥对红壤团聚体有机碳库及土壤二氧化碳排放的影响[D]. 北京: 中国科学院大学, 2015. Qian H Y. Effect of long-term manure application on organic carbon pools in red sol aggregates and soil CO2 emission. Beijing: University of Chinese Academy of Sciences, 2015. (  0) 0) |
| [16] |
Li Y K, Chen M P, Mei X R, et al. Effects of soil moisture and nitrogen addition on organic carbon mineralization in a high-yield cropland soil of the North China Plain (In Chinese)[J]. Acta Ecologica Sinica, 2014, 34(14): 4037-4046. [李银坤, 陈敏鹏, 梅旭荣, 等. 土壤水分和氮添加对华北平原高产农田有机碳矿化的影响[J]. 生态学报, 2014, 34(14): 4037-4046.]
(  0) 0) |
| [17] |
Li D P, Wang H, Sun T, et al. Effects of mechanical compaction on soil microbial activities and carbon emission of oasis agricultural soils in Xinjiang (In Chinese)[J]. Transactions of the Chinese Society of Agricultural Engineering, 2018, 34(20): 124-131. DOI:10.11975/j.issn.1002-6819.2018.20.016 [李典鹏, 王辉, 孙涛, 等. 机械压实对新疆绿洲农田土壤微生物活性及碳排放的影响[J]. 农业工程学报, 2018, 34(20): 124-131.]
(  0) 0) |
| [18] |
Novara A, Armstrong A, Gristina L, et al. Effects of soil compaction, rain exposure and their interaction on soil carbon dioxide emission[J]. Earth Surface Processes and Landforms, 2012, 37(9): 994-999. DOI:10.1002/esp.3224
(  0) 0) |
| [19] |
Li C H, Ma B L, Zhang T Q. Soil bulk density effects on soil microbial populations and enzyme activities during the growth of maize(Zea mays L.)planted in large pots under field exposure[J]. Canadian Journal of Soil Science, 2002, 82(2): 147-154. DOI:10.4141/S01-026
(  0) 0) |
| [20] |
Whalley W R, Dumitru E, Dexter A R. Biological effects of soil compaction[J]. Soil and Tillage Research, 1995, 35(1/2): 53-68.
(  0) 0) |
| [21] |
van der Linden A M A, Jeurissen L J J, van Veen J A, et al. Turnover of the soil microbial biomass as influenced by soil compaction[M]//Nitrogen in organic wastes. Amsterdam: Elsevier, 1989: 25—36.
(  0) 0) |
| [22] |
Beare M H, Gregorich E G, St-Georges P. Compaction effects on CO2 and N2O production during drying and rewetting of soil[J]. Soil Biology & Biochemistry, 2009, 41(3): 611-621.
(  0) 0) |
| [23] |
Kim H, Anderson S H, Motavalli P P, et al. Compaction effects on soil macropore geometry and related parameters for an arable field[J]. Geoderma, 2010, 160(2): 244-251. DOI:10.1016/j.geoderma.2010.09.030
(  0) 0) |
| [24] |
Feng Y, Wang J M, Bai Z K, et al. Three-dimensional quantification of macropore networks of different compacted soils from opencast coal mine area using X-ray computed tomography[J]. Soil & Tillage Research, 2020, 198: 104567.
(  0) 0) |
| [25] |
Liebig M A, Jones A J, Doran J W, et al. Potential soil respiration and relationship to soil properties in ridge tillage[J]. Soil Science Society of America Journal, 1995, 59(5): 1430-1435. DOI:10.2136/sssaj1995.03615995005900050032x
(  0) 0) |
| [26] |
Ding W X, Meng L, Yin Y F, et al. CO2 emission in an intensively cultivated loam as affected by long-term application of organic manure and nitrogen fertilizer[J]. Soil Biology & Biochemistry, 2007, 39(2): 669-679.
(  0) 0) |
| [27] |
Linn D M, Doran J W. Effect of water-filled pore space on carbon dioxide and nitrous oxide production in tilled and nontilled soils[J]. Soil Science Society of America Journal, 1984, 48(6): 1267-1272. DOI:10.2136/sssaj1984.03615995004800060013x
(  0) 0) |
 2022, Vol. 59


