2. 河南省土壤肥料站, 郑州 450002
2. Henan Provincial Station of Soil and Fertilizer, Zhengzhou 450002, China
土壤有机碳(Soil organic carbon,SOC)库是陆地生态系统的最大碳库,其微小变化能显著影响大气二氧化碳浓度。2015年第21届联合国气候变化峰会(the 21st Conference of the Parties,COP21)提出4‰计划得到超过150个国家响应。该计划明确以0~2 m土体2 400亿t SOC储量计,全球SOC以4‰年速率增长可以抵消全球每年人为排放的8.9亿t温室气体量,能有效抑制全球变暖[1]。但全球土壤中能通过管理措施对SOC变化施加积极影响的主要是农业土壤[1];尽管如此,管理得当仍可能使全球农业土壤在近20年内抵消20%~35%的碳排放[1]。然而,由于土壤固碳潜力与影响因素的时空复杂性,上述估测精度远远不够。长期试验表明在大量添加有机肥、秸秆还田和减免耕措施下只有砂土和粉砂土能在全剖面实现SOC年增长4‰,而有机质丰富的土壤只有表层能实现该目标[2]。据对20个国家和地区的分析,Minasny等[1]认为在最好的管理措施下,初始SOC低于10 g∙kg–1的农业土壤在未来20年甚至能以年均1%的速度增长;而初始SOC含量高者则不会有预期增速。我国除东北黑土区和青藏高原外,当前多数地区SOC呈增长趋势,但增速时空变异较大[3-16];且以往研究主要关注耕层,对耕层以下SOC的时空变化研究较少。在产量不断攀升条件下,仅根系量的增长就能为土壤提供持续碳源[3,14];而小麦、玉米根系可达1~2 m深度,20~100 cm以内SOC均有增加可能性[17-19]。因此,有必要提供三维的、空间明晰的耕地SOC变化以增进对农业土壤固碳潜力的认识。
当前,对于土壤发育时间短、初始碳含量低,但近30年来产量不断攀升的黄淮海农业区的三维SOC变化还研究不足,其主要限制在土壤剖面样本数量:自20世纪80年代全国第二次土壤普查以来,只在“我国土系调查与《中国土系志》编制”项目支撑下进行了2010s省级和国家尺度的土壤剖面调查,所得剖面相对较少[20];由于不同时期采样位置和采样数差异,以上述数据研究SOC时空变化可能使结果产生较大不确定性;但除此以外,多数地区没有其他数据能说明该阶段SOC三维变化。本研究采用最新的数字土壤制图方法以部分补偿样点稀疏的影响[21],通过不确定性分析辅助判断SOC时空变化。
河南省粮食产量占我国10.6%[22],农业土壤面积占黄淮海平原的1/4,其SOC变化同时具有重要的生态和生产意义。本文以河南省为例,对不同深度土层SOC变化进行研究,并探讨生物气候、土壤性质等对其影响,以增进对区域SOC变化的理解。
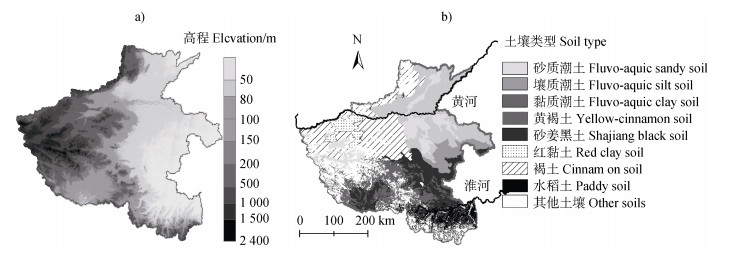
1 材料与方法 1.1 研究区概况河南省面积16.7×10⁴ km2,海拔23~2 387 m,山地、平原分别占44%和56%(图 1a);自北向南由温带过度至亚热带,年均降雨量500 ~1 200 mm,年均温12.0~15.5℃。其东部温带平原和西南盆地以潮土、砂姜黑土为主,西部山地丘陵主要分布褐土、黄褐土,均为小麦-玉米轮作。淮河南部亚热带以水稻土为主,并进一步区分为稻-麦轮作(沿淮低地起伏平原)和单季稻(靠近南部省界山区),下文分别以水稻土A和水稻土B表示(图 1b)。

|
图 1 河南省高程(a)和土壤类型(b)分布图 Fig. 1 Elevation map(a)and soil type map(b)of Henan Province |
(1)从1982—1983年第二次土壤普查时期各县土种志和相关专著[23-24]共筛选2 979个耕地土壤剖面,将按发生层描述的有机质(%)乘以5.8,并按照等积样条函数处理为0~15 cm、15~30 cm、30~60 cm、60~100 cm标准深度SOC(g∙kg–1)[25];由于部分土壤未采到1 m深度,各土层样本数实际为2 979、2 979、2 929、2 776。(2)从河南耕地地力评价数据库中筛选出2010—2012年13 372个0~15 cm土壤耕层有机质数据,转化为SOC值。(3)2010—2012年新调查187个耕地土壤剖面(其中168个见《中国土系志河南卷》)[20],将其SOC值转换为上述深度区间的SOC。(1)~(3)分别标记为SOC1982,SOC2010top,SOC2010。样点分布见图 2。

|
图 2 土壤采样点分布 Fig. 2 Soil sample sites |
根据数字土壤制图的SCORPAN范式[21],选择包括生物、气候、地形、土壤4类共26个指标作为预测SOC的协变量。其中,归一化植被指数(NDVI)采用全球库存监控和建模系统(Global Inventory Monitoring and Modeling System)(https://gimms.gsfc.nasa.gov/MODIS/)的1982—1984年数据和地理空间数据云(http://www.gscloud.cn/sources/)的2010—2012年数据;NPP数据源自全球变化科学数据出版系统[26];采用中国地面气候标准值年值数据集(http://data.cma.cn/data/cdcdetail/dataCode/),提取1980—2010年均干燥度、蒸发、降雨量、> 0 ℃积温、年均温、气温年较差。
地形变量用自动化地球科学分析系统(SAGA GIS)(http://www.saga-gis.org)提取ASTER GDEM 30 m生成,包括高程、坡度、坡向、平面曲率、剖面曲率、地形湿度、物质平衡指数、风暴露指数、多分辨率分水岭平坦度指数、多分辨率谷底平坦度指数、地形粗糙度、排水网基准高度、与最近排水网垂直距离。
土壤变量包括1︰20万土壤类型、母质、土体构型图斑[27]、黏粒(< 0.002 mm)和粉粒(0.002~0.05 mm)含量(经等积样条函数转化为相应深度土层数据后执行Kriging插值,各土层黏粒、粉粒预测值与实测值R2达0.36~0.42和0.24~0.32,极显著相关)。以上数据统一重采样为公里网格,作为预测SOC的环境协变量。
以下数据用于分析1982—2010年的SOC变化,但未参与SOC预测,包括:(1)1980—2010年均气温变化,从中国平均水热条件变化公里网格数据集(1951—2010年)提取[28]。(2)2010—2012年土壤0~15 cm采样点对应的产量、秸秆还田量、灌溉指数(用灌溉保证百分率表示)(源自河南省耕地地力评价数据库,系各县基层农技人员调查获取,随土壤采样信息一起上报)。(3)2010年土壤pH(15 cm以下土壤pH以表层pH和环境协变量联合预测,R2达0.72~0.98,详见文献[29])。
1.4 SOC时空变化分析采用分位数随机森林(Quantile Random Forest,QRF)预测SOC及其变化[30]。其原理为:通过样本训练构建大量协变量与预测变量的回归树模型,每个树模型预测出特定情境(环境协变量随机组合)下的一个SOC值,大量随机树模型运算得到若干等概率结果。每个位置2010年所有SOC可能值与1982年所有SOC可能值随机抽样相减获得一次SOC变化的估计;根据蒙特卡洛模拟原理,基于足够多的随机抽样可对SOC变化概率和变化值进行估计。具体步骤如下:
(1)各层均按SOC值排列数据,分组随机抽取其中20%数据构建验证集,其余数据参与建模。
(2)1982年和2010年0~15 cm土层SOC预测。调用软件R4.0.3的quantreg工具包执行QRF[31],按0.002的间隔,分别得到每个公里网格对应累积概率0.002~1.0的1982年和2010年SOC含量各500次,各取其500次均值为预测值。
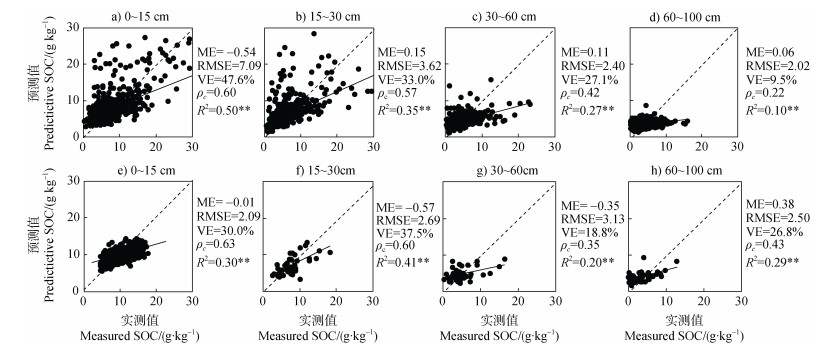
(3)1982年和2010年15 cm以下土层SOC预测。由于表层土壤往往和深层土壤SOC具有密切关系,且通常表层SOC又能取得较高预测精度[32],因此将0~15 cm SOC预测结果加入深层SOC预测的协变量集合,采用与(1)-(2)相同方法得到结果;增加该步骤可充分利用2010年表层土壤样本数量较多的优势,明显削减了该期土壤剖面样点不足对深层SOC预测的限制(模型对15~30 cm、30~60 cm、60~100 cm检验数据的方差解释比分别从0.11、0.12、0.25提高至0.41、0.19、0.27)。
(4)结果检验。检验参数包括平均误差(ME)、均方根误差(RMSE)、模型对原始数据方差解释比(Explainable Variance,简写为VE:
| $ {\text{VE}} = 1 - \frac{{\sum\nolimits_{i = 1}^n {{{\left( {{O_i} - {M_i}} \right)}^2}} }}{{\sum\nolimits_{i = 1}^n {{{({O_i} - \bar O)}^2}} }} $ | (1) |
林氏系数
| $ {\rho _c} = \frac{{2R{\sigma _0}{\sigma _M}}}{{\sigma _0^2 + \sigma _M^2 + {{(\bar O - \bar M)}^2}}} $ | (2) |
式中,
(5)分别从每个公里网格的1982年的500次结果和2010年的500次结果中随机取1个相减,得到1个SOC变化值;采用放回式重复随机取样并相减,得到每个网格1982—2010年SOC变化(ΔSOC)的1000次结果(算法通过Matlab编程实现)。
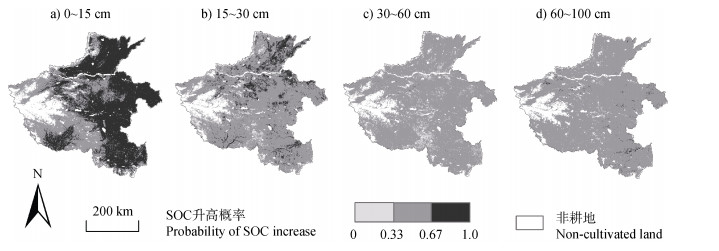
(6)计算每个网格点1 000次ΔSOC > 0的概率。参照Minasny等[34]的划分,以0~0.33、0.33~0.67、0.67~1.0三个概率区间分别代表明显降低、无明显变化和明显升高。
1.5 SOC时空变化影响因素分析从2010年样点中选择与1982年样点距离小于50 m的样点1 932个,进行配对比较(15 cm以下SOC2010从预测结果中提取),用ΔSOC标记SOC变化量,按土壤类型进行比较,并计算ΔSOC与SOC1982、黏粒、粉粒、2010年土壤pH、1982—2010年均降雨、年均温、平均气温年较差、2001—2010年均温与1971—1980年均温之差、2010—2012年作物年均产量、2010—2012年秸秆年均还田量、灌溉指数等的Pearson相关系数。
1.6 SOC储量计算用等积样条函数将按发生层记录的土壤容重转化为上述各土层容重,其中1982年容重按kriging插值、2010年容重按亚类取均值再转化为公里网格;同理处理2 mm石砾和砂姜含量(仅按1982年数据);从耕地地力数据库提取2012年河南耕地分布图,并转化为公里网格(图略);以上数据代入式(3)计算SOC储量。
| $ {\text{SO}}{{\text{C}}_{\text{S}}} = \sum\limits_{i = 1}^n {(1 - {\theta _i}} ){\rho _i}{T_i}/100 \times S \times {\text{SOC}} $ | (3) |
式中,SOCS表示单个栅格SOC储量(t),θi表示第i层石砾和砂姜的总含量(%),ρi表示第i层土壤容重(g ·cm–3),n=4代表自上而下4个土层,Ti为第i层厚度(cm),S为单位栅格面积(m2),SOC为栅格土壤有机碳含量(g·kg–1)。
2 结果与讨论 2.1 SOC基本统计特征由表 1可知,1982—2010年河南耕地各层SOC均值均有所增长,自0~15 cm向下各层依次增加2.36、1.65、0.77、0.59 g∙kg–1。1982年SOC具有更大的取值区间、峰度和偏度;而2010年的显著特征是0~15 cm SOC变异系数明显降低、深层SOC变异系数变化不大。
|
|
表 1 1982年和2010年土壤有机碳分层统计特征 Table 1 Summary statistics of SOC in different depth intervals for 1982 and 2010 |
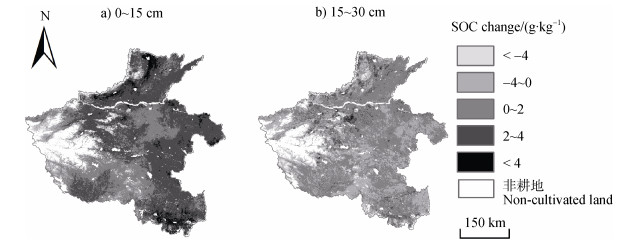
检验表明各层SOC的预测值与实测值均达到极显著相关,结果可靠(图 3)。两个时期均显示0~15 cm和15~30 cm西部山区SOC大于东部平原区,且平原区南部SOC大于北部;30~60 cm除潮土区较低外,其他区域SOC的含量相当;60~100 cm SOC空间差异最低(图 4)。ΔSOC概率图确认东部平原和西部山区中的盆地0~15 cm SOC普遍增长(图 5a),该变化使全省0~15 cm SOC空间差异降低(图 4e);15~30 cm SOC的增长区呈大斑块状分布于黄河沿岸壤质潮土和砂质潮土区,以及零星分布于褐土、水稻土区(图 5b);0~15 cm和15~30 cm SOC增幅分别介于2~4 g∙kg–1和0~2 g∙kg–1之间(图 6)。30~60 cm SOC无明显增长区,甚至有零星下降区(图 5c);而60~100 cm则几乎无显著变化(图 5d)。如果考虑计算误差,可近似认为30 cm以下无变化。

|
注:**表示相关系数在P < 0.01水平上显著 Note: **denotes that correlation coefficient is significant at the level of P < 0.01 图 3 土壤有机碳预测均值的精度检验(上:1982,下:2010) Fig. 3 The verification for predicted mean SOC(Upper: 1982, Below: 2010). |

|
图 4 1982年和2010年土壤有机碳预测均值 Fig. 4 The mean SOC predicted by Quantile random forest of 1982 and 2010 |

|
图 5 1982—2010年河南省耕地土壤有机碳升高概率 Fig. 5 The probability of SOC increase in Henan cultivated soils over 1982-2010 |

|
图 6 1982—2010年0~15 cm和15~30 cm层的SOC预测均值变化 Fig. 6 The predicted mean SOC changes in the layers of 0-15 cm and 15-30 cm over 1982-2010 |
按均值,水稻土B(单季稻区)0~15 cm SOC增长最多,其次为潮土和水稻土A(稻麦轮作区),再次为砂姜黑土、褐土和黄褐土,其平均增幅依次为2.84、2.56、2.49、2.28、2.24、1.58 g∙kg–1;而在15~30 cm SOC增长则按潮土、褐土、水稻土A、水稻土B、黄褐土、砂姜黑土的顺序递减,平均增长依次为1.14、1.04、0.91、0.87、0.60、0.13 g∙kg–1(图 7)。不同土壤类型ΔSOC的相关因素差异明显,但生物气候条件对0~15 cm层ΔSOC的影响一般大于土壤质地、pH等的作用(表 2);在15~30 cm层生物气候对ΔSOC的影响则明显降低(表 3)。

|
注1:水稻土A源自沿淮低地起伏平原区稻-麦轮作,水稻土B源自靠近南部省界山区单季稻。下同。 注2:不同字母表示差异显著(P < 0.01)。 Note 1:Paddy soil A distributed in a low relief plain along the Huai river with the rotation of rice-wheat and paddy; Soil B is distributed in the hill region that is close to the province borderline with the rotation of rice-fallow. The same below Note 2:Different characters represent the significant difference at the P < 0.01 level based on the Mann-Whitney test. 图 7 1982—2010年各土类0~15 cm和15~30 cm土壤有机碳增长量对比 Fig. 7 The comparison of SOC increase over 1982-2010 in both 0-15 cm and 15-30 cm layers among soil types |
|
|
表 2 0~15 cm SOC增长量的相关因素 Table 2 The Pearson correlation coefficient of ΔSOC of 0~15cm soil layer with some selected variables |
|
|
表 3 15~30 cm SOC增长量的相关因素 Table 3 The Pearson correlation coefficient of ΔSOC of 15~30 cm soil layer with some selected variables |
具体而言,旱地土壤以及水旱轮作土壤0~15 cm ΔSOC均与作物产量、秸秆还田量关系极显著;且旱地0~15 cm ΔSOC又与灌溉指数相关性极显著,说明了投入土壤的生物量及相关生产要素对ΔSOC的直接和间接贡献。但可能因为减耕效应[35],以及由于位于山区,受局部地形、水热变异的影响,单季稻区ΔSOC与产量和秸秆还田等的相关性不显著。旱地0~15 cm ΔSOC均与气温年较差关系极显著,该结果与多数研究一致[9,36]:暖季利于干物质积累、而冷季则抑制其分解;上述关系在15~30 cm土层仍存在(表 3),只是仅局限于更加冷凉的北部褐土和潮土区;位于亚热带的水稻土ΔSOC与气温年较差则无明显关系。此外,年均温与ΔSOC正相关或不相关、气温变化与ΔSOC负相关或不相关,既体现了热量对于生物和SOC积累的正面作用,又反映了气候变暖对SOC积累的负面影响。
在0~15 cm土层,砂姜黑土ΔSOC与黏粒含量呈极显著正相关,潮土ΔSOC与粉粒含量呈显著正相关、与黏粒含量仅弱相关(P < 0.1),其他土壤的质地与ΔSOC无明显关系。虽然细粒物质是决定SOC固持潜力的重要因素,但ΔSOC还受初始含量、管理因素等影响[4-5,16-17,35-36],如Zheng等[37]研究表明随SOC增加,ΔSOC与土壤类型、土壤质地的关系减弱;而土壤类型内质地是否有明显分异也会影响其与ΔSOC的统计关系。剖面土壤质地变化使各层水分、养分和通气条件差异明显,其中轻壤土和壤土较黏土更利于根系发育,影响根的剖面分布[38],这使得砂质和壤质潮土15~30 cm SOC增加几率较其他区域更大(图 5b),相应潮土该层ΔSOC与黏粒和粉粒含量呈负相关。其他土壤ΔSOC在15~30 cm与质地的关系则无确定规律。
近期有研究表明土壤酸化对SOC变化有重要影响[39]。黄褐土是河南pH最低、且近年酸化明显的土壤[29];但本研究只发现其15~30 cm ΔSOC与pH呈负相关。作为复杂系统,土壤的SOC变化是多因素综合作用的结果;15~30 cm SOC与土壤管理的关系减弱,而与土壤性质的关系加强,可能使pH作用凸显。而对于褐土、砂姜黑土、潮土等中性至偏碱性土壤,pH一般与碳酸钙含量成正比,而后者利于形成土壤团聚体,从而对SOC保存和提高有利[40],它们0~30 cm的ΔSOC与pH呈正相关(除潮土0~15 cm内二者不相关)。
ΔSOC往往与SOC初始值呈负相关[1-4]。但对0~15 cm土层,本文只发现砂姜黑土、水稻土A存在该关系;其他旱地土壤未表现该关系,可能与不同土壤的固碳潜力及其SOC初始值差异有关;水稻土B则可能受减耕效应影响,也未表现该关系。但所有土壤15~30 cm ΔSOC均与其初始值呈显著或极显著负相关,与该层SOC固存潜力低一致。
2.4 耕地增持SOC速率与COP21目标比较以2012年耕地7 791×104 hm–2计,河南1982年1 m土体耕地SOC总储量为50 770万t;摒除不能确定变化的区域,28年增长7.04 %,年增长速率2.43‰;其中0~15 cm和15~30 cm的总增长量分别为3 151万t和425万t,分别占88.1%和11.9%。按单位面积计,0~15 cm SOC年增长0.16 t·hm–2,略低于福建同期0~15 cm年增长率0.19 t·hm–2[13],略高于安徽同期0~20 cm年增长速率0.15 t·hm–2[14],与赵永存等[4]统计的我国耕地0~30 cm SOC年增长率0.09~0.28 t·hm–2也较符合。
在所有人为可控因素中,秸秆还田可能是当前普遍发生的、最利于促进SOC增长的因素[5,7,14,36,41-42],本文也确认其效应。但秸秆还田增加了SOC的活性成分比例[41],该部分SOC被分解的机率亦较大;其效应受土壤、气候和初始SOC含量影响,随时长而降低[42];当前政策鼓励氮肥减量施用,但随C/N比增加,如果施氮不足,可能促进有机质矿化、抵消部分秸秆还田效应。基于全国性数据的Meta分析表明秸秆还田处理下SOC增幅仅高于对照7.9%~15.4%,而秸秆还田超过10年后SOC反而下降[42];以上研究均不支持秸秆还田具有长期固碳效应。太湖流域SOC在2000—2015年呈缓慢下降趋势[43];河南砂姜黑土和水稻土A的SOC1982与ΔSOC的负相关也说明其SOC增速可能将降低,而潮土和水稻土B的SOC当前增速也仅略高于水稻土A和砂姜黑土;而气候变暖可能降低SOC固存潜力、缩短土壤达到碳饱和的时间。
综上分析,即便采取秸秆还田和保护性耕作,多数农业区SOC增速估计难达到4‰。因此,本文认同Baveye等的观点——耕地SOC增加远不能抵消人类碳排放[44],降低碳的净排放量是抑制气候变化的根本。
3 结论1982—2010年河南平原和盆地区耕地0~15 cm土层的SOC增加明显,增加幅度2~4 g∙kg–1,其他农区增加不明显,但亦无明显下降,该层SOC储量增加占比88.1%;15~30 cm土层SOC增加主要发生在沿黄壤质、砂质潮土区和零星的褐土、水稻土区,增加幅度0~2 g∙kg–1,该层SOC储量增加占比11.9%;30 cm以下土层的SOC变化不明显。生物气候条件对ΔSOC的作用大于土壤属性。除单季稻区可能受“养地”影响外,其他区域SOC均与生物量输入显著或极显著相关;气温年较差对处于温带旱地SOC积累影响更显著、对亚热带稻区影响不明显;气候变暖明显对SOC积累不利;由于所处环境和土壤性质差异,不同土壤类型质地和pH与ΔSOC的关系可变性较大。耕地1 m土体SOC总储量为50 770万t,历经28年1 m土体总增长率为7.04%,年均增长率为2.43‰,远低于COP21目标;考虑到今后秸秆还田促进土壤固碳的效应可能减弱以及全球变暖等不利因素,不应过高估计农业土壤固碳的环境效应。
| [1] |
Minasny B, Malone B P, McBratney A B, et al. Soil carbon 4 per mille[J]. Geoderma, 2017, 292: 59-86. DOI:10.1016/j.geoderma.2017.01.002
(  0) 0) |
| [2] |
Dal Ferro N, Piccoli I, Berti A, et al. Organic carbon storage potential in deep agricultural soil layers: Evidence from long-term experiments in northeast Italy[J]. Agriculture, Ecosystems & Environment, 2020, 300: 106967.
(  0) 0) |
| [3] |
Ludwig B, Hu K L, Niu L G, et al. Modelling the dynamics of organic carbon in fertilization and tillage experiments in the North China Plain using the Rothamsted Carbon Model—initialization and calculation of C inputs[J]. Plant and Soil, 2010, 332(1/2): 193-206.
(  0) 0) |
| [4] |
Zhao Y C, Xu S X, Wang M Y, et al. Carbon sequestration potential in Chinese cropland soils: Review, challenge, and research suggestions (In Chinese)[J]. Bulletin of Chinese Academy of Sciences, 2018, 33(2): 191-197. [赵永存, 徐胜祥, 王美艳, 等. 中国农田土壤固碳潜力与速率: 认识、挑战与研究建议[J]. 中国科学院院刊, 2018, 33(2): 191-197.]
(  0) 0) |
| [5] |
Zhao Y C, Wang M Y, Hu S J, et al. Economics- and policy-driven organic carbon input enhancement dominates soil organic carbon accumulation in Chinese croplands[J]. Proceedings of the National Academy of Sciences of the United States of America, 2018, 115(16): 4045-4050.
(  0) 0) |
| [6] |
Ou Y, Rousseau A N, Wang L X, et al. Spatio-temporal patterns of soil organic carbon and pH in relation to environmental factors—A case study of the Black Soil Region of Northeastern China[J]. Agriculture, Ecosystems & Environment, 2017, 245: 22-31.
(  0) 0) |
| [7] |
Xia X Q, Yang Z F, Liao Y, et al. Temporal variation of soil carbon stock and its controlling factors over the last two decades on the southern Song-Nen Plain, Heilongjiang Province[J]. Geoscience Frontiers, 2010, 1(1): 125-132. DOI:10.1016/j.gsf.2010.07.003
(  0) 0) |
| [8] |
Cheng H X, Bai R J, Li K, et al. Study of loss or gain of soil organic carbon in Da'an region, Jilin Province in China[J]. Journal of Geochemical Exploration, 2012, 112: 272-275. DOI:10.1016/j.gexplo.2011.09.004
(  0) 0) |
| [9] |
Dai F Q, Su Z G, Liu S Z, et al. Temporal variation of soil organic matter content and potential determinants in Tibet, China[J]. Catena, 2011, 85(3): 288-294. DOI:10.1016/j.catena.2011.01.015
(  0) 0) |
| [10] |
Wang L G, Qiu J J, Tang H J, et al. Modelling soil organic carbon dynamics in the major agricultural regions of China[J]. Geoderma, 2008, 147(1/2): 47-55.
(  0) 0) |
| [11] |
Cao X H, Long H Y, Lei Q L, et al. Spatio-temporal variations in organic carbon density and carbon sequestration potential in the topsoil of Hebei Province, China[J]. Journal of Integrative Agriculture, 2016, 15(11): 2627-2638. DOI:10.1016/S2095-3119(15)61239-4
(  0) 0) |
| [12] |
Yang F, Xu Y, Cui Y, et al. Variation of soil organic matter content in croplands of China over the last three decades (In Chinese)[J]. Acta Pedologica Sinica, 2017, 54(5): 1047-1056. [杨帆, 徐洋, 崔勇, 等. 近30年中国农田耕层土壤有机质含量变化[J]. 土壤学报, 2017, 54(5): 1047-1056.]
(  0) 0) |
| [13] |
Wu S R, Wei J, Qiu L X, et al. Study of Soil Organic Carbon Sequestration Rate and Potential of Farmland Soil in Fujian Province Based on the Large Scale Soil Database (In Chinese)[J]. Acta Pedologica Sinica, 2022, 59(5): 1293-1305. [吴世蓉, 位佳, 邱龙霞, 等. 基于大比例尺数据库的福建省耕地土壤固碳速率和潜力研究[J]. 土壤学报, 2022, 59(5): 1293-1305.]
(  0) 0) |
| [14] |
Zhao M S, Li D C, Wang S H. Variation of soil organic carbon in farmland of Anhui and its influencing factors in the 30 years from 1980 to 2010 (In Chinese)[J]. Acta Pedologica Sinica, 2018, 55(3): 595-605. [赵明松, 李德成, 王世航. 近30年安徽省耕地土壤有机碳变化及影响因素[J]. 土壤学报, 2018, 55(3): 595-605.]
(  0) 0) |
| [15] |
Li L, Zhang S K, Wu K N, et al. Analysis on spatio-temporal variability of soil organic matter in Henan Province based on soil taxonomy (In Chinese)[J]. Acta Pedologica Sinica, 2015, 52(5): 979-990. [李玲, 张少凯, 吴克宁, 等. 基于土壤系统分类的河南省土壤有机质时空变异[J]. 土壤学报, 2015, 52(5): 979-990.]
(  0) 0) |
| [16] |
Guo N J, Shi X Z, Zhao Y C, et al. Environmental and anthropogenic factors driving changes in paddy soil organic matter: A case study in the middle and Lower Yangtze River plain of China[J]. Pedosphere, 2017, 27(5): 926-937. DOI:10.1016/S1002-0160(17)60383-7
(  0) 0) |
| [17] |
Dong L, Shi X Z, Xu S X, et al. Effects of different management measures on the organic carbon of farmland soil profile in China based on meta-analysis (In Chinese)[J]. Soils, 2021, 53(6): 1290-1298. [董丽, 史学正, 徐胜祥, 等. 基于Meta分析研究不同管理措施对中国农田土壤剖面有机碳的影响[J]. 土壤, 2021, 53(6): 1290-1298.]
(  0) 0) |
| [18] |
Liang F, Li J W, Zhang S Q, et al. Two-decade long fertilization induced changes in subsurface soil organic carbon stock vary with indigenous site characteristics[J]. Geoderma, 2019, 337: 853-862.
(  0) 0) |
| [19] |
Blanco-Canqui H, Shapiro C, Jasa P, et al. No-till and carbon stocks: Is deep soil sampling necessary? Insights from long-term experiments[J]. Soil and Tillage Research, 2021, 206: 104840.
(  0) 0) |
| [20] |
Wu K N, Li L, Ju B, et al. Henan volume in soil series of China (In Chinese). Beijing: Science Press, 2019. [吴克宁, 李玲, 鞠兵, 等. 中国土系志·河南卷[M]. 北京: 科学出版社, 2019.]
(  0) 0) |
| [21] |
Minasny B, McBratney A B. Digital soil mapping: A brief history and some lessons[J]. Geoderma, 2016, 264: 301-311.
(  0) 0) |
| [22] |
National Burea of Statistics. 2021 China Statistical Year Book (In Chinese). Beijing: China Statistics Press, 2021. [国家统计局. 2021中国统计年鉴[M]. 北京: 中国统计出版社, 2021.]
(  0) 0) |
| [23] |
Wei K X. Henan soil geography (In Chinese). Zhengzhou: Science and Technology Press of Henan Province, 1995. [魏克循. 河南土壤地理[M]. 郑州: 河南科学技术出版社, 1995.]
(  0) 0) |
| [24] |
Soil Survey Office of Henan Province. Soil Series of Henan Province . Beijing: China.
(  0) 0) |
| [25] |
Agriculture Press, 1995.[河南省土壤肥料工作站河南省土壤普查办公室. 河南土种志[M]. 北京: 中国农业出版社, 1995.]
(  0) 0) |
| [26] |
Malone B P, McBratney A B, Minasny B, et al. Mapping continuous depth functions of soil carbon storage and available water capacity[J]. Geoderma, 2009, 154(1/2): 138-152.
(  0) 0) |
| [27] |
Chen P F. Monthly NPP dataset covering China's terrestrial ecosystems at north of 18°N(1985–2015) (In Chinese)[J]. Journal of Global Change Data & Discovery, 2019, 3(1): 34—41, 143. [陈鹏飞. 北纬18°以北中国陆地生态系统逐月净初级生产力1公里栅格数据集(1985—2015)[J]. 全球变化数据学报, 2019, 3(1): 34—41, 143.]
(  0) 0) |
| [28] |
Zhao Y F, Zhang H N, Cheng D Q, et al. Cultivated land productivity evaluation at provincial scale based on a map of grouped soil profile configuration pattern (In Chinese)[J]. Chinese Journal of Soil Science, 2015, 46(5): 1040-1048. [赵彦锋, 张化楠, 程道全, 等. 基于归并"土体构型"图的省域耕地地力评价[J]. 土壤通报, 2015, 46(5): 1040-1048.]
(  0) 0) |
| [29] |
Ning X J, Qin Y C, Cui Y P, et al. Hydrothermal conditions change data of China in 1km resolution in decades from 1951 to 2010 [J/DB/OL]. Digital Journal of Global Change Data Repository, 2016. https://doi.org/10.3974/geodb.2016.01.07.V1.[宁晓菊, 秦耀辰, 崔耀平, 等, 中国10年平均水热条件变化公里网格数据集(1951-2010)[J/DB/OL]. 全球变化数据仓储电子杂志, 2016. https://doi.org/10.3974/geodb.2016.01.07.V1.]
(  0) 0) |
| [30] |
Wei X T. The changes of soil pH and its' uncertainties in Henan Province in recent 40 years[D]. Zhengzhou: Zhengzhou University, 2021.[魏鑫涛. 河南省近40年土壤pH变化及其度量的不确定性[D]. 郑州: 郑州大学, 2021.]
(  0) 0) |
| [31] |
Meinshausen N. quantregForest: Quantile Regression Forests. 2017. http://github.com/lorismichel/quantregForest.
(  0) 0) |
| [32] |
R Core Team, R Foundation for Statistical Computing. R: A language and environment for statistical computing. 2020. https://www.r-project.org/.
(  0) 0) |
| [33] |
Liu F, Zhang G L, Sun Y J, et al. Mapping the three-dimensional distribution of soil organic matter across a subtropical hilly landscape[J]. Soil Science Society of America Journal, 2013, 77(4): 1241-1253.
(  0) 0) |
| [34] |
Lin L I. A concordance correlation coefficient to evaluate reproducibility[J]. Biometrics, 1989, 45(1): 255-268.
(  0) 0) |
| [35] |
Minasny B, Hong S Y, Hartemink A E, et al. Soil pH increase under paddy in south Korea between 2000 and 2012[J]. Agriculture, Ecosystems & Environment, 2016, 221: 205-213.
(  0) 0) |
| [36] |
Tian K, Zhao Y C, Xing Z, et al. A meta-analysis of long-term experiment data for characterizing the topsoil organic carbon changes under different conservation tillage in cropland of China (In Chinese)[J]. Acta Pedologica Sinica, 2013, 50(3): 433-440. [田康, 赵永存, 邢喆, 等. 中国保护性耕作农田土壤有机碳变化速率研究——基于长期试验点的Meta分析[J]. 土壤学报, 2013, 50(3): 433-440.]
(  0) 0) |
| [37] |
Guo N J, Shi X Z, Zhao Y C, et al. Comparative study on impacts of anthropogenic and environment factors on soil organic matter: A case study of typical black soil region and paddy soil region (In Chinese)[J]. Acta Pedologica Sinica, 2016, 53(5): 1097-1106. [郭乃嘉, 史学正, 赵永存, 等. 人为与环境因子对农田土壤有机质影响的比较研究——以典型黑土区和水稻土区为例[J]. 土壤学报, 2016, 53(5): 1097-1106.]
(  0) 0) |
| [38] |
Zheng L, Wu W L, Wei Y P, et al. Effects of straw return and regional factors on spatio-temporal variability of soil organic matter in a high-yielding area of Northern China[J]. Soil and Tillage Research, 2015, 145: 78-86.
(  0) 0) |
| [39] |
Hu T J. Wheat ecology and production (In Chinese). Zhengzhou: Science and Technology Press of Henan Province, 1986. [胡廷积. 小麦生态与生产技术[M]. 郑州: 河南科学技术出版社, 1986.]
(  0) 0) |
| [40] |
Zhang X M, Guo J H, Vogt R D, et al. Soil acidification as an additional driver to organic carbon accumulation in major Chinese croplands[J]. Geoderma, 2020, 366: 114234.
(  0) 0) |
| [41] |
Zhao H L, Zhang H J, Shar A G, et al. Enhancing organic and inorganic carbon sequestration in calcareous soil by the combination of wheat straw and wood ash and/or lime[J]. PLoS One, 2018, 13(10): e0205361.
(  0) 0) |
| [42] |
Zhao H L, Dong J J, Shi J L, et al. Effect of straw returning mode on soil organic carbon sequestration (In Chinese)[J]. Acta Pedologica Sinica, 2021, 58(1): 213-224. [赵惠丽, 董金琎, 师江澜, 等. 秸秆还田模式对小麦-玉米轮作体系土壤有机碳固存的影响[J]. 土壤学报, 2021, 58(1): 213-224.]
(  0) 0) |
| [43] |
Wang Y L, Wu P N, Mei F J, et al. Does continuous straw returning keep China farmland soil organic carbon continued increase? A meta-analysis[J]. Journal of Environmental Management, 2021, 288: 112391.
(  0) 0) |
| [44] |
Xie E Z, Zhang X, Lu F Y, et al. Integration of a process-based model into the digital soil mapping improves the space-time soil organic carbon modelling in intensively human-impacted area[J]. Geoderma, 2022, 409: 115599.
(  0) 0) |
| [45] |
Baveye P C, Berthelin J, Tessier D, et al. The "4 per 1000" initiative: A credibility issue for the soil science community?[J]. Geoderma, 2018, 309: 118-123.
(  0) 0) |
 2023, Vol. 60

