微塑料由于其小而轻、难降解等特征,具有极强的可迁移性,可借助风、水、食物链等途径迁移[1–2],最终进入土壤不断累积并长期存在于土壤中,影响土壤生态系统的功能和生物多样性[3-4]。尤其在环境驱动因素的作用下,微塑料可发生老化/风化破碎[5],改变其大小尺寸和表面性质(如颜色、化学成分、结晶度和吸附能力等),进而影响微塑料的吸附和迁移等环境行为[6-7]。现有研究已发现,紫外线辐射光降解[8–10]、风力[11]、流水[12-13]和微生物[14-15]等环境因素均可影响微塑料的老化破碎行为。侵蚀泥沙迁移是影响土壤空间分布的重要环境行为之一,对微塑料在陆地生态系统中的分布和污染风险有重要作用[16-17],但泥沙迁移过程中的磨蚀作用对微塑料产生的机械破碎作用,目前还缺乏系统认识。
黄土高原是我国重要的生态保护区域,同时也是人类活动聚居区[18]。近年来,随着人口增长和生活水平提升,土壤微塑料污染加重[19]。作为侵蚀敏感区域,黄土高原泥沙含沙量常在50~1 100 kg·m–3之间[20-21],大量的泥沙迁移可显著影响微塑料在流域内的空间分布特征[13]。但在不同含沙量条件下,黄土泥沙动态迁移过程中的黏度值显著不同[22],可直接影响其泥沙机械磨蚀对微塑料老化破碎的作用效率。因此本文选取黄土高原多年覆膜的玉米地土壤作为研究对象,对比分析不同情境下泥沙磨蚀作用对微塑料丰度及其形态特征的影响,以期揭示泥沙磨蚀作用对微塑料的破碎机理,为侵蚀环境下土壤微塑料的破碎迁移风险评估提供理论参考。
1 材料与方法 1.1 实验设计及方法选取黄土高原王东沟小流域多年覆膜的玉米地,于2021年8月按照五点法用土钻采集0~20 cm的表层土壤,混合均匀后带回实验室风干处理。为探究泥沙磨蚀作用对微塑料老化破碎的影响,对比设置风干原土和泥沙浸润静置两种处理。同时,参照黄土高原强降雨条件下的含沙量和径流流速变化范围,设置560 kg·m–3、800 kg·m–3和930 kg·m–3三种含沙量,在转速180 r·min–1回旋式旋转条件下进行为期4个月泥沙磨蚀模拟试验。每个处理3个重复(图 1)。试验转速180 r·min–1约相当于1.55 m·s–1的径流速度,远大于黄土区坡面径流平均流速(0.34 m·s–1~0.52 m·s–1)[23],但本试验主要通过高速旋转震荡创造泥沙扰动条件,用以补偿野外泥沙迁移过程中水流震荡条件的缺失。在回旋式旋转震荡过程中,所有锥形瓶均进行封口处理,并每隔10 d进行称重补水,以排除水分损失对试验结果的影响。试验结束后,分离提取不同处理泥沙中的微塑料,并采用激光红外成像系统测定微塑料的丰度、类型和形态等特征。

|
注:OS:风干原土;ST:泥沙浸润静置;SA:泥沙磨蚀;SA-Low:低含沙量;SA-Moderate:中含沙量;SA-High:高含沙量。下同。 Note: OS: Air-dried original soil; ST: Wet soil stand-still; SA: Soil abrasion; SA-Low: Soil abrasion with low soil concentration; SA-Moderate: Soil abrasion with moderate soil concentration; SA-High: Soil abrasion with high soil concentration. The same as below. 图 1 模拟实验示意图 Fig. 1 Schematic diagram of experimental design |
本研究采用密度离心法提取微塑料。具体操作如下:取50 g的风干样品于100 mL烧杯中,加入60 mL的浓度为1.7~1.8 kg·L–1的ZnCl2溶液,充分搅拌2 min并静置过夜。隔天将悬浮液转移至另一个烧杯中,并加入30%的H2O2溶液60 mL以去除有机物,充分搅拌后静置24 h,使得H2O2溶液与土壤有机物充分反应。将溶液进行真空抽滤(滤膜直径为0.22 μm),得到含有微塑料的滤膜,随后将滤膜浸入乙醇溶液中进行超声处理,使得滤膜上的微塑料分散在乙醇溶液中。最后将含有微塑料的乙醇溶液进行浓缩,滴加在高反玻璃上,待乙醇完全挥发后,通过激光红外成像系统(Agilent 8700 LDIR,可测定最小粒径为10 μm)和Clarity软件分析样品中微塑料的丰度、类型以及形态特征。其中,本研究将微塑料的形状按照实心度(表征每个微塑料颗粒面积与其边界面积之比)和圆度(表征每个微塑料颗粒与圆形的相似程度)属性分为碎片(实心度 > 0.2或圆度 < 0.8),纤维(实心度 < 0.2)和微球(圆度 > 0.8)[24]。本研究只选择与Agilent 8700 LDIR数据库匹配度大于65%的微塑料进行分析。此外,鉴于在泥沙样本中观察到的微塑料种类繁多(超过30种),本研究只介绍丰度最高的前9种主要类型,而其余的塑料类型则统称为“其他”。
1.3 数据处理与统计分析微塑料丰度以“n·kg–1”为单位,使用Excel 2021,Origin 2022和IBM SPSS Statistics(22.0.0.0版)统计分析了微塑料的丰度以及形态特征数据;采用Origin 2022绘制了不同磨蚀处理和不同含沙量处理下微塑料平均丰度和平均面积的箱线图并进行单因素方差分析,此外还绘制了不同磨蚀处理和不同含沙量处理下微塑料形态特征的柱状图,以及微塑料类型分布的百分比图和气泡图,最后对不同含沙量磨蚀作用下的不同类型微塑料的所有指标进行聚类分析;采用SPSS对微塑料的总丰度和形状进行相关性分析(皮尔逊),使用单因素分析方法,在0.05水平上进行分析。
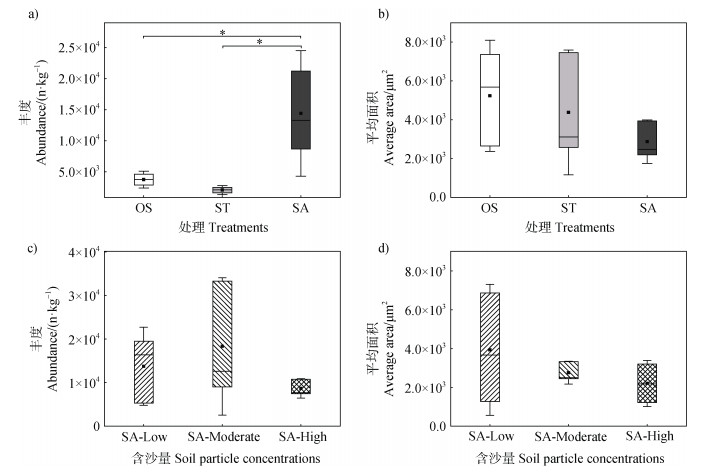
2 结果 2.1 不同浸润静置与磨蚀作用下泥沙微塑料丰度及面积分布与风干原土微塑料丰度相比(3 767 n·kg–1),泥沙磨蚀处理下微塑料的平均丰度显著更高,达到14 400 n·kg–1(丰度范围在8 700~21 200 n·kg–1之间)(P < 0.05),泥沙浸润静置处理下的微塑料的丰度仅为2 067 n·kg–1(图 2a)。与风干原土微塑料的平均面积相比(5 234 μm2),泥沙浸润和磨蚀处理均在一定程度上削减了微塑料平均面积,但差异不显著,整体呈现风干原土 > 泥沙静置 > 泥沙磨蚀的趋势(图 2b)。

|
注:*为P≤0.05,**为P≤0.01,***为P≤0.001,下同。 Note: * P≤0.05, ** P≤0.01, *** P≤0.001. The same as below. 图 2 静置与泥沙磨蚀作用下微塑料的丰度和平均面积分布 Fig. 2 Distribution of microplastic abundances and average area with and without abrasive disturbance |
三种不同含沙量磨蚀作用下泥沙中微塑料的平均丰度和平均面积均存在差异(图 2c,图 2d)。总体而言,微塑料平均丰度呈现趋势为:中含沙量(18 300 n·kg–1) > 低含沙量(13 730 n·kg–1) > 高含沙量(8 667 n·kg–1),而微塑料的平均面积呈现的趋势为:低含沙量(3 932 μm2) > 中含沙量(2472 μm2) > 高含沙量(2099 μm2)(图 2d)。
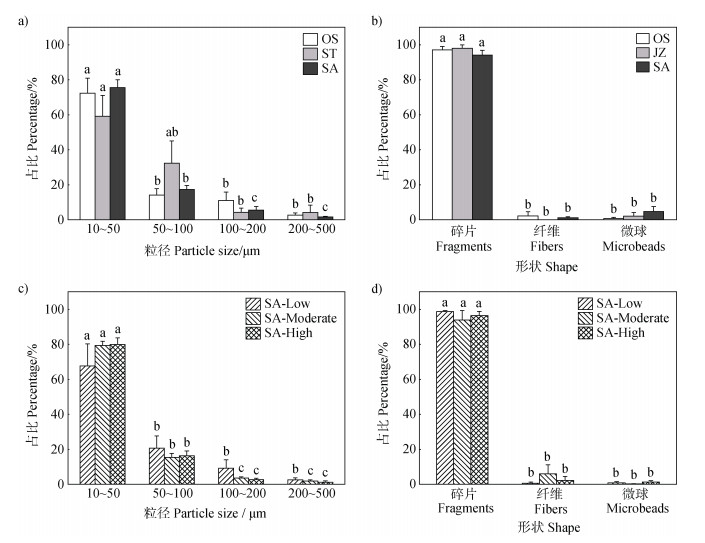
2.2 不同浸润静置与磨蚀作用下泥沙微塑料粒径及形态分布所有处理下的微塑料均以10~50 μm粒径为主(图 3a,图 3c),其占比均显著高于其他粒径。具体而言,浸润静置处理下,粒径为50~100 μm的微塑料占比与其他粒径之间均无显著性差异,而风干原土和泥沙磨蚀在粒径为50~100 μm的微塑料占比显著低于粒径为10~50 μm的微塑料(图 3a)。就三种不同含沙量磨蚀处理而言,10~50 μm的微塑料颗粒由低含沙量的67.6%提高至高含沙量的79.79%(图 3c)。

|
注:相同粒径和相同形状在不同处理之间不存在显著性差异,不同小写字母表示相同处理在不同粒级和不同形状之间存在差异(P ≤ 0.05)。下同。 Note: No significant differences existed between different treatments for the same particle size and the same shape, and different lowercase letters indicate differences between the same treatments for the same particle size and shape(P ≤ 0.05). The same as below. 图 3 静置与泥沙磨蚀作用下微塑料的粒径和形态分布 Fig. 3 Distribution of microplastic particle size and shape with and without abrasive disturbance |
所有处理下的微塑料均以碎片形状为主,其丰度占比均大于93%,显著高于纤维(占比小于6%)和微球形状(占比小于5%)(图 3b,图 3d)。其中,静置与泥沙磨蚀作用下,泥沙磨蚀处理中微球形状微塑料的占比高于风干原土和静置浸润处理,占比达4.7%(图 3b)。具体而言,中含沙量磨蚀处理下,碎片状塑料减少,而纤维状微塑料增加至5.94%,远大于低含沙量(0.64%)和高含沙量(2.22%)中纤维状微塑料的占比;在高含沙量磨蚀处理下,微球状塑料增加至1.37%,大于低含沙量(0.8%)和高含沙量(0.2%)中微球状微塑料的占比(图 3d)。
静置与泥沙磨蚀作用下微塑料的丰度与形状皮尔逊相关性分析表明(表 1),碎片形状微塑料的占比与微塑料的总丰度存在显著负相关关系,而塑料微球的占比与微塑料的总丰度存在显著正相关关系。同时,塑料微球的占比与碎片形状微塑料的占比存在显著负相关关系(表 1)。
|
|
表 1 静置与泥沙磨蚀作用下微塑料的丰度与形状相关性 Table 1 The correlation analysis of microplastic abundance and shape with and without abrasive disturbance |
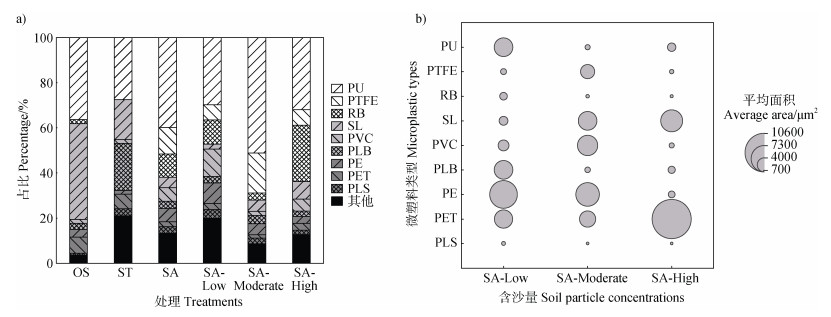
本研究中丰度最高的前9种微塑料类型及占比分别为聚氨酯(PU)39.37%、聚四氟乙烯(Polytetrafluoroethylene,PTFE)10.95%、橡胶(Rubber,RB)9.37 %、硅树脂(Silicone,SL)6.55%、聚氯乙烯(PVC)5.78%、聚丁二烯(Polybutadiene,PLB)3.52%、聚乙烯(PE)5.71 %、聚对苯二甲酸乙二酯(PET)2.53%、和聚砜(Polysulfone,PLS)2.8%。其余丰度较低的微塑料类型统称为“其他”(图 4a)。

|
注:PU:聚氨酯;PTFE:聚四氟乙烯;RB:橡胶;SL:硅树脂;PVC:聚氯乙烯;PLB:聚丁二烯;PE:聚乙烯;PET:聚对苯二甲酸乙二酯;PLS:聚砜。下同。 Note: PU: Polyurethane; PTFE: Polytetrafluoroethylene; RB: Rubber; SL: Silicone; PVC: Polyvinyl chloride; PLB: Polybutadiene; PE: polyethylene; PET: Polyethylene terephthalate; PLS: Polysulfone. The same as below. 图 4 不同处理微塑料的类型占比和不同含沙量下微塑料的平均面积分布 Fig. 4 Microplastic composition in different treatments and average area distribution among the treatments with different soil particle concentrations |
不同含沙量磨蚀作用下,不同类型微塑料的占比差异较大(图 4a)。其中,低含沙量磨蚀处理下占比较高的三种微塑料类型为PU(29.68%)、PE(9.00%)和PTFE(6.81%);中含沙量磨蚀处理下占比较高的四种微塑料类型为PU(51.19%)、PTFE(17.73%)、SL(4.94%)和PE(4.94%);而高含沙量磨蚀处理下占比较高的三种微塑料类型为PU(31.92%)、RB(25.00%)和SL(7.69%)。其中RB和SL丰度随着含沙量的增高而明显增多,而PE、PVC和PLS丰度随着含沙量的增高而明显减少,但PU和PTFE丰度则在中含沙量处理下含量最高(图 4a)。
各含沙量处理下PET类型的微塑料的平均面积均较大(4 388~10 570 μm2),而RB类型微塑料的平均面积均较小(931~2 063 μm2)(图 4b)。不同含沙量磨蚀作用下不同类型微塑料的平均面积存在差异(图 4b):PU、PLB和PE类型的微塑料面积随着含沙量的增高而减小(图 4b),从低含沙量的5 117 μm2、5 064 μm2、7 347 μm2,减小至高含沙量的2 306 μm2、1 952 μm2、1 873 μm2。相反,SL类型微塑料面积则从低含沙量的2 451 μm2增加至高含沙量的5 974 μm2,而PET类型微塑料面积从低含沙量的4 917 μm2增加至高含沙量的10 580 μm2(图 4b)。
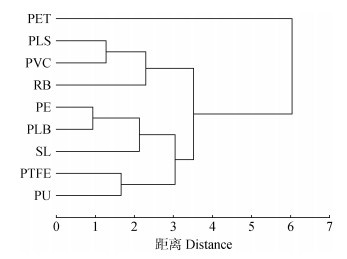
通过对不同含沙量磨蚀作用下泥沙样品中前9种主要类型的微塑料进行聚类分析(图 5),在不同含沙量磨蚀作用下,不同类型的微塑料呈现出共生和同源组合,或可具有一定的相似性或者同质性(图 5)。具体而言,根据竖线距离长短所示亲缘关系,本试验样品中微塑料类型可分为3个族群:第1簇群为PU、PTFE、SL、PLB和PE类型的微塑料,具有一定的同源同质性;第2簇群为RB、PVC和PLS类型的微塑料;而PET类型的微塑料与其他类型的微塑料均不相似,为单一元素簇群(图 5)。

|
图 5 不同含沙量下前9种主要微塑料类型的聚类分析 Fig. 5 Cluster analysis of the top 9 microplastic types with different soil particle concentrations |
相对于风干原土和泥沙浸润静置,泥沙磨蚀处理下微塑料的平均丰度显著增大,平均面积则明显减少(图 1),且泥沙磨蚀处理下小粒径微塑料的占比增大(图 3),这些结果均表明泥沙磨蚀过程中的机械磨损可使微塑料变形和破碎。静置与泥沙磨蚀作用下微塑料的丰度与形状相关性分析也表明,泥沙磨蚀主要通过将碎片形状微塑料逐渐破碎成为微球和纤维形状的微塑料来增加微塑料总丰度(表 1)。该结果有力佐证了前期研究在河流或河滩泥沙中的微塑料形态特征,如陈守益等[25]发现渭河流域的泥沙对微塑料的破碎有较大影响,可加速微塑料老化进程;而Zhang等[26]则认为在河滩迁移过程中,微塑料会受到推移质和悬移质输送过程的影响而发生磨蚀破碎,进而形成粒径更小的微塑料。
然而,不同含沙量磨蚀作用对微塑料丰度、平均面积和粒径的改变却随含沙量的变化没有统一的线性关系(图 1,图 3),这可能与泥沙黏滞性和磨蚀量与含沙量的非线性关系有关[27-28]。当含沙量较小时,泥沙黏滞性较小,磨蚀强度主要受水流撞击作用和土壤颗粒间的摩擦力对微塑料产生机械破坏作用,且这种磨蚀作用可随着含沙量的增大而增强。目前尚未有关于泥沙磨蚀作用对微塑料破碎老化影响直接相关的研究,但以往关于含沙量与土壤团聚颗粒破碎程度的研究已明确,在含沙量总体较小的情况下,雷诺数和泥沙团聚颗粒破碎程度与含沙量呈线性正相关关系[29]。而当含沙量过大,泥沙黏滞性显著增高,颗粒在水体内的活动距离和空间受限,泥沙颗粒间的撞击作用甚至还会对水流重力起到削弱减缓的作用,可能致使其对微塑料的磨蚀破碎作用也相应减弱。这可能是导致中含沙量处理下,泥沙中碎片状微塑料明显减少,而纤维状的微塑料显著增加(图 3)的主要原因。此外,Miller[30]通过泥沙磨蚀模拟试验还发现,泥沙扰动磨蚀在16 h内便可去除30%的微生物。考虑到微生物和微塑料与泥沙颗粒表面结合机理的相似性,本研究强调在未来研究中应该进一步系统探讨泥沙迁移过程中颗粒质地及尺寸、水流速度和深度,以及下垫面粗糙度等因素对泥沙磨蚀强度和微塑料等微观物质附着和剥离作用的影响。
各类型微塑料占比和平均面积在不同含沙量磨蚀处理下均存在差异(图 4a,图 4b),这说明不同类型微塑料对三种含沙量磨蚀破碎作用的敏感程度不同。这可能与微塑料的密度、形态或来源等自身特性相关[31]:比如,PET类型的微塑料作为单一元素簇群(图 5),密度较其他类型微塑料大且较为坚硬(密度高达1.67 g·cm–3)[32],因此,在高黏性-低磨蚀量的高含沙量处理下无法被有效破碎而保持较大的平均面积(图 4b)。PLB和PE类型的微塑料的聚类亲缘关系最近(图 5),其在不同含沙量磨蚀作用下破碎行为相似,均表现随着含沙量的增加,丰度减小且平均面积也变小(图 4)。同时,PU和PTFE作为亲缘关系较近的另一亚簇群(图 5),其丰度随含沙量增加而增大,但均在中含沙量下达到最大丰度值(图 4),说明PU和PTFE这两种类型的微塑料对不同含沙量下的泥沙黏滞性和磨蚀量变化较为敏感,或可在未来研究中作为泥沙磨蚀作用强度的指示微塑料。
4 结论相对于风干原土和泥沙浸润静置,泥沙磨蚀处理下微塑料的平均丰度显著增大,而平均面积则明显减少,且泥沙磨蚀处理下小粒径微塑料的占比增大,说明泥沙磨蚀过程中的机械磨损可使微塑料变形和破碎。此外,不同含沙量磨蚀作用对微塑料丰度、平均面积和粒径的改变却与含沙量高低没有统一的线性关系,水流撞击作用和土壤颗粒间的摩擦力对微塑料产生机械破坏作用在中含沙量处理下达到最大值。同时,在不同含沙量磨蚀处理下,各微塑料类型的占比和平均面积均存在差异,说明不同类型微塑料对三种含沙量磨蚀破碎作用的敏感程度不同。以上结果表明,泥沙机械磨蚀可直接影响微塑料老化破碎的作用效率,这为侵蚀环境下沉积区域土壤中微塑料的破碎迁移风险评估提供了一定的理论参考。
| [1] |
Guo J J, Huang X P, Xiang L, et al. Source, migration and toxicology of microplastics in soil[J]. Environment International, 2020, 137: 105263. DOI:10.1016/j.envint.2019.105263
(  0) 0) |
| [2] |
Zhou Y J, Wang J X, Zou M M, et al. Microplastics in soils: A review of methods, occurrence, fate, transport, ecological and environmental risks[J]. Science of the Total Environment, 2020, 748: 141368. DOI:10.1016/j.scitotenv.2020.141368
(  0) 0) |
| [3] |
Raju S, Carbery M, Kuttykattil A, et al. Transport and fate of microplastics in wastewater treatment plants: Implications to environmental health[J]. Reviews in Environmental Science and Bio/Technology, 2018, 17(4): 637-653. DOI:10.1007/s11157-018-9480-3
(  0) 0) |
| [4] |
Zhang G S, Zhang F X, Li X T. Effects of polyester microfibers on soil physical properties: Perception from a field and a pot experiment[J]. Science of the Total Environment, 2019, 670: 1-7. DOI:10.1016/j.scitotenv.2019.03.149
(  0) 0) |
| [5] |
Duan J J, Bolan N, Li Y, et al. Weathering of microplastics and interaction with other coexisting constituents in terrestrial and aquatic environments[J]. Water Research, 2021, 196: 117011. DOI:10.1016/j.watres.2021.117011
(  0) 0) |
| [6] |
Mueller M T, Fueser H, Trac L N, et al. Surface-related toxicity of polystyrene beads to nematodes and the role of food availability[J]. Environmental Science & Technology, 2020, 54(3): 1790-1798.
(  0) 0) |
| [7] |
Ren Z F, Gui X Y, Xu X Y, et al. Microplastics in the soil-groundwater environment: Aging, migration, and co-transport of contaminants - A critical review[J]. Journal of Hazardous Materials, 2021, 419: 126455. DOI:10.1016/j.jhazmat.2021.126455
(  0) 0) |
| [8] |
Celina M, Linde E, Brunson D, et al. Overview of accelerated aging and polymer degradation kinetics for combined radiation-thermal environments[J]. Polymer Degradation and Stability, 2019, 166: 353-378. DOI:10.1016/j.polymdegradstab.2019.06.007
(  0) 0) |
| [9] |
Liu F, Olesen K B, Borregaard A R, et al. Microplastics in urban and highway stormwater retention ponds[J]. Science of the Total Environment, 2019, 671: 992-1000. DOI:10.1016/j.scitotenv.2019.03.416
(  0) 0) |
| [10] |
Zhu K C, Jia H Z, Sun Y J, et al. Long-term phototransformation of microplastics under simulated sunlight irradiation in aquatic environments: Roles of reactive oxygen species[J]. Water Research, 2020, 173: 115564. DOI:10.1016/j.watres.2020.115564
(  0) 0) |
| [11] |
Ho N H E, Not C. Selective accumulation of plastic debris at the breaking wave area of coastal waters[J]. Environmental Pollution, 2019, 245: 702-710. DOI:10.1016/j.envpol.2018.11.041
(  0) 0) |
| [12] |
Hurley R, Woodward J, Rothwell J J. Microplastic contamination of river beds significantly reduced by catchment-wide flooding[J]. Nature Geoscience, 2018, 11: 251-257. DOI:10.1038/s41561-018-0080-1
(  0) 0) |
| [13] |
Wang X J, Wang Y N, Zhao J, et al. Recent progress of the effect of suspended sediment movement on the transport of microplastics in rivers (In Chinese)[J]. China Environmental Science, 2022, 42(2): 863-877. DOI:10.3969/j.issn.1000-6923.2022.02.041 [王薪杰, 王一宁, 赵俭, 等. 河流水沙运动对微塑料运移过程影响研究进展[J]. 中国环境科学, 2022, 42(2): 863-877.]
(  0) 0) |
| [14] |
Dawson A L, Kawaguchi S, King C K, et al. Turning microplastics into nanoplastics through digestive fragmentation by Antarctic krill[J]. Nature Community, 2018, 9: 1001. DOI:10.1038/s41467-018-03465-9
(  0) 0) |
| [15] |
Hu T T, Chen J W. A review on adsorption and transport of microplastics in soil and the effect of ageing on environmental behavior of pollutants (In Chinese)[J]. Rock and Mineral Analysis, 2022, 41(3): 353-363. [胡婷婷, 陈家玮. 土壤中微塑料的吸附迁移及老化作用对污染物环境行为的影响研究进展[J]. 岩矿测试, 2022, 41(3): 353-363.]
(  0) 0) |
| [16] |
Barnes D K A, Galgani F, Thompson R C, et al. Accumulation and fragmentation of plastic debris in global environments[J]. Philosophical Transactions of the Royal Society of London Series B, Biological Sciences, 2009, 364(1526): 1985-1998. DOI:10.1098/rstb.2008.0205
(  0) 0) |
| [17] |
Fok L, Cheung P K, Tang G, et al. Size distribution of stranded small plastic debris on the coast of Guangdong, South China[J]. Environmental Pollution, 2017, 220: 407-412. DOI:10.1016/j.envpol.2016.09.079
(  0) 0) |
| [18] |
Li X C, Meng Q S. Analysis on small watershed ecological and economic system in gully regions of the Loess Plateau—A case study in Wangdonggou watershed of Changwu County, Shaanxi (In Chinese)[J]. Journal of Northwest A&F University(Social Science Edition), 2008, 8(3): 9—13, 31. DOI:10.3969/j.issn.1009-9107.2008.03.003 [李晓春, 孟全省. 黄土高原沟壑区小流域生态与经济要素演变及相互作用——以陕西省长武县王东沟小流域为例[J]. 西北农林科技大学学报(社会科学版), 2008, 8(3): 9—13, 31.]
(  0) 0) |
| [19] |
Hao Y L, Hu Y X, Bai X X, et al. Abundances and morphology patterns of microplastics under different land use types on the Loess Plateau (In Chinese)[J]. Environmental Science, 2022, 43(9): 4748-4755. [郝永丽, 胡亚鲜, 白晓雄, 等. 黄土高原土地利用方式对微塑料丰度和形态分布的影响[J]. 环境科学, 2022, 43(9): 4748-4755.]
(  0) 0) |
| [20] |
Wang X K, Qian N, Hu W D. The formation and process of confluence of the flow with hyperconcentration in the gullied-hilly loess areas of the Yellow River Basin (In Chinese)[J]. Journal of Hydraulic Engineering, 1982, 13(7): 26-35. DOI:10.3321/j.issn:0559-9350.1982.07.004 [王兴奎, 钱宁, 胡维德. 黄土丘陵沟壑区高含沙水流的形成及汇流过程[J]. 水利学报, 1982, 13(7): 26-35.]
(  0) 0) |
| [21] |
Yu G A. Re-discussion on the formation mechanism of two types of debris flows (In Chinese)[J]. Journal of Natural Disasters, 2022, 31(1): 238-250. [余国安. 两类泥石流形成机制的再讨论[J]. 自然灾害学报, 2022, 31(1): 238-250.]
(  0) 0) |
| [22] |
Lu X F. Influence of sediment concentration and diameter on flow characteristics[D]. Zhengzhou: North China University of Water Resources and Electric Power, 2018.[路新飞. 含沙量和泥沙粒径对水流特性的影响[D]. 郑州: 华北水利水电大学, 2018.]
(  0) 0) |
| [23] |
Wang H X. Experimental study on the characteristics and mechanism of slope erosion of different vegetation patterns in loess region of western Shanxi Province[D]. Beijing: Beijing Forestry University, 2021.[王恒星. 晋西黄土区不同植被格局坡面侵蚀特征及机理试验研究[D]. 北京: 北京林业大学, 2021.]
(  0) 0) |
| [24] |
Li X T, Liang R F, Li Y, et al. Microplastics in inland freshwater environments with different regional functions: A case study on the Chengdu Plain[J]. Science of the Total Environment, 2021, 789: 147938. DOI:10.1016/j.scitotenv.2021.147938
(  0) 0) |
| [25] |
Chen S Y. The aging process of microplastics and its influence on the sorption of pollutants[D]. Huainan, Anhui: Anhui University of Science & Technology, 2019.[陈守益. 微塑料的老化过程及其对污染物吸附的影响机制[D]. 安徽淮南: 安徽理工大学, 2019.]
(  0) 0) |
| [26] |
Zhang H. Transport of microplastics in coastal seas[J]. Estuarine, Coastal and Shelf Science, 2017, 199: 74-86. DOI:10.1016/j.ecss.2017.09.032
(  0) 0) |
| [27] |
Chu Q H, Ren Y. Abrasion performance of water turbine under different conditions of sediments concentration and flow velocity (In Chinese)[J]. Yellow River, 2011, 33(8): 120-121. [楚清河, 任岩. 不同含沙量不同流速下水轮机磨蚀性能研究[J]. 人民黄河, 2011, 33(8): 120-121.]
(  0) 0) |
| [28] |
He X K. Abrasion failure of material under different sand contents and flow velocities (In Chinese)[J]. Journal of Hydroelectric Engineering, 1996, 15(3): 79-86. [何筱奎. 不同含沙量不同流速时材料的磨蚀失效特性[J]. 水力发电学报, 1996, 15(3): 79-86.]
(  0) 0) |
| [29] |
Wang J G, Yu B, Ni S M, et al. Effects of sediment load on the abrasion of soil aggregate and hydraulic parameters in experimental overland flow[J]. Journal of Integrative Agriculture, 2020, 19(4): 1117-1126. DOI:10.1016/S2095-3119(19)62719-X
(  0) 0) |
| [30] |
Miller D C. Abrasion effects on microbes in sandy sediments[J]. Marine Ecology Progress Series, 1989, 55: 73-82. DOI:10.3354/meps055073
(  0) 0) |
| [31] |
Guo X T, Pang J W, Chen S Y, et al. Sorption properties of tylosin on four different microplastics[J]. Chemosphere, 2018, 209: 240-245. DOI:10.1016/j.chemosphere.2018.06.100
(  0) 0) |
| [32] |
Rehm R, Zeyer T, Schmidt A, et al. Soil erosion as transport pathway of microplastic from agriculture soils to aquatic ecosystems[J]. Science of the Total Environment, 2021, 795: 148774.
(  0) 0) |
 2024, Vol. 61


