2. 中国科学院土壤环境与污染修复重点实验室, 南京 211135;
3. 国家红壤改良工程技术研究中心, 中国科学院红壤生态实验站, 江西鹰潭 335211;
4. 鹰潭市农业农村粮食局, 江西鹰潭 335001;
5. 鹰潭市余江区农业农村粮食局, 江西鹰潭 335211
2. Key Laboratory of Soil Environment and Pollution Remediation, Institute of Soil Science, Chinese Academy of Sciences, Nanjing 211135, China;
3. National Engineering and Technology Research Center for Red Soil Improvement, Red Soil Ecological Experiment Station, Chinese Academy of Sciences, Yingtan, Jiangxi 335211, China;
4. Yingtan Agricultural and Rural Grain Bureau, Yingtan, Jiangxi 335001, China;
5. Agricultural and Rural Grain Bureau of Yujiang District, Yingtan, Jiangxi 335211, China
20世纪中期以来,随着工业化发展对有色金属的依赖加重,通过大气沉降、废渣淋溶、污水灌溉等途径导致冶炼厂周边农田土壤重金属污染严重。根据2014年《全国土壤污染状况调查公报》[1]和《2021年中国生态环境状况公报》[2]显示,我国耕地土壤点位污染物超标率为19.4%,影响农用地土壤环境质量的主要污染物是重金属。其中,镉(Cd)、铜(Cu)、铅(Pb)为我国农田土壤重金属污染的主要元素,并被美国环境保护署列为优先污染物。加强土壤污染源头防控,精准开展土壤污染防治成为当下我国重要战略任务。量化分析土壤重金属输入输出特征、及时了解农田重金属的污染来源,对开展农田土壤重金属污染风险评估和精准管控工作具有重要意义。
目前,农田土壤重金属的输入输出平衡研究主要集中在法国[3]、瑞士[4]、埃及[5]、澳大利亚[6]、中国[7]等国家。近三年,我国建立了全国不同区域尺度(贵州威宁[8]、天津武清[9]、宁夏宁南山[10]、沈阳张士灌区[11]、山西太原[12]、湖南湘潭[13]、河北石家庄[14]、浙江衢州[15]等)的农田土壤Cd、Cu、Pb输入输出清单。总体而言,农田生态系统中土壤重金属的主要输入途径为大气沉降、灌溉水和农药肥料等,主要输出途径为地表径流、土壤淋溶和植物提取等。但是不同地区农田土壤重金属输入输出特征存在差异,现有的研究多针对田间大尺度,鲜有针对不同沉降区、不同污染程度农田土壤重金属污染的长期监测,定量核算各输入输出途径对土壤重金属的相对贡献率的研究亦少见[16]。
因此,本研究选择贵溪冶炼厂周边不同的大气沉降区农田耕层土壤为研究对象,连续三年采用污染源定量分析方面有着较大优势的化学质量平衡模型(CMB)[17]探析耕层土壤Cd、Cu、Pb输入输出特征,定量分析不同潜在源对耕层土壤重金属的相对贡献和土壤重金属净累积量,对该地区土壤重金属污染防治、农田环境质量保护具有理论指导和现实意义。
1 材料与方法 1.1 研究区域贵溪冶炼厂为我国最大的现代化铜冶炼厂,距江西省贵溪市中心约5 km,有40多年的冶炼历史。本研究在距离冶炼厂西南方向(主风向下风)34 km、6 km、1 km处各布设一个质量平衡试验点位,分别记为背景区、中沉降区和高沉降区,研究区域农田土壤基本化学性质见表 1。其中,背景区和中沉降区种植水稻,水稻品种均为五优华占;高沉降区因常年受到冶炼厂排放的“三废”、大气沉降等方面的影响,土壤重金属含量高、生物活性较强,现已无法耕种。
|
|
表 1 研究区域农田土壤基本化学性质 Table 1 Basic chemical properties of agricultural soils in study areas |
2017年12月在背景区、中沉降区和高沉降区分别布置三个平行试验小区(3 m(长)× 3 m(宽)× 0.6 m(高)),并在2019-2021年进行质量平衡样品采集。农药(卤氧氟- r -甲基)和肥料(钙镁磷肥、土壤改良剂)在水稻生长期施加并收集保存于密封袋中,每年收集三次。大气沉降(包括干、湿沉降)使用降尘缸(内径16 cm,高35 cm)收集,将其固定放置于距地面1.5 m以上,周边无高大建筑遮掩,每月更换降尘缸1次[18]。在水稻生长期间,每次灌溉即采集1次灌溉水样50 mL于聚四氟乙烯(PTEF)瓶中并加入HNO3(0.5%,v/v)。
各试验小区用聚氯乙烯(PVC)板制成的长方体(无盖无底)围板,埋深0.5 m,并高出地面0.1 m。在PVC板一侧安装带阀门的排水口,并在地块中央与PVC板相同深度的地下埋设一块渗透板(0.5 m× 0.5 m),外接水管及水桶,分别用来采集地表径流和地下渗透水样,采集时间与大气沉降时间一致,水样收集于50 mL PTEF瓶中,然后加入HNO3(0.5%)。植物成熟期,水稻仅收获籽粒,秸秆回田。
1.3 样品分析供试土壤理化性质采用土壤农化分析方法[19]进行测定;水样使用0.45 μm滤膜过滤加入HNO3(0.5%)酸化、植物样品采用HNO3-HCl混合酸进行消解、土壤和大气干沉降样品采用HNO3-HF-HClO4混合酸消解[20-21]。酸化样品、消解待测液使用电感耦合等离子体质谱(ICP-MS,Agilent 7700x,美国)测定Cd、Cu、Pb含量;同时,用柑橘叶GBW10020(GSB-11)和土壤GBW07427(GSS-13)作为对照样品,回收率为96.2%~104%。
1.4 重金属输入输出通量农药肥料:农药肥料的重金属年输入通量(QPF,i)(mg·m–2·a–1)计算公式如下:
| $ {Q_{{\text{PF, }}i}} = \sum\nolimits_{j = 1}^n {\left( {{C_{{\text{P, }}i}}{M_{{\text{P, }}i}} + {C_{F{\text{, }}i}}{M_{{\text{F, }}i}}} \right)} \times {10^{ - 4}} $ | (1) |
式中,j为农药和肥料类别;Cp,i为农药中重金属(i)的浓度,mg·kg–1;Mp,i为实际施用的农药量,kg·hm–2·a–1;CF,i为肥料中重金属(i)的浓度,mg·kg–1;MF,i为实际施肥量,kg·hm–2·a–1。中沉降区使用卤氧氟- r -甲基、钙镁磷肥和土壤改良剂,背景区仅使用卤氧氟- r -甲基和钙镁磷肥。
大气沉降:大气沉降中重金属的沉降通量(QA,i)(mg·m–2·a–1)计算公式如下:
| $ {Q_{{\text{A, }}i}} = \sum\nolimits_{j = 1}^n {\left( {{C_{{\text{d, }}ji}}{M_{{\text{d, }}ji}} + {C_{W{\text{, }}ji}}{V_{{\text{W, }}ji}}} \right)} /{\text{A}} $ | (2) |
式中,Cd,ji为第j月干沉降部分重金属(i)的浓度,mg·kg–1;Md,ji为干沉降部分的质量,kg;Cw,ji为第j月湿沉降部分重金属(i)的浓度,mg·L–1;Vw,ji为湿沉降部分的体积,L;A为降尘缸瓶口面积,m2;j为采集大气沉降样品的月份,n=12。
灌溉水:灌溉水中重金属输入通量(QI,i)(mg·m–2·a–1)计算公式如下:
| $ {Q_{{\text{I, }}i}} = \sum\nolimits_{j = 1}^n {{C_{ji}}{V_{ji}} \times {{10}^{ - 4}}} $ | (3) |
式中,Cji为第j次灌溉收集的灌溉水中重金属(i)的浓度,mg·L–1;Vji为第j次灌溉水用量,L·hm–2·a–1;n表示灌溉次数。中沉降区的灌溉水来自信江支流,背景区的灌溉水来自周边水库,分属不同水源。
地表径流:地表径流水样每月采集时间与大气沉降时间一致,水样收集于50 mL PTEF瓶中,然后加入HNO3(0.5%)。地表径流中重金属输出通量(
| $ {Q_{{\text{S, }}i}} = \sum\nolimits_{j = 1}^n {{C_{{\text{S, }}ji}}{V_{{\text{S, }}ji}} \times {{10}^{ - 4}}} $ | (4) |
式中,
土壤淋溶:土壤淋溶水样每月采集时间与大气沉降时间一致,水样收集于50 mL PTEF瓶中,然后加入HNO3(0.5%)。土壤淋溶中重金属输出通量(QL,i)(mg·m–2·a–1)计算公式如下:
| $ {Q_{{\text{L, }}i}} = \sum\nolimits_{j = 1}^n {{C_{{\text{L, }}ji}}{V_{{\text{L, }}ji}} \times {{10}^{ - 4}}} $ | (5) |
其中,
籽粒带走:水稻籽粒重金属输出通量(QP, i)(mg·m–2·a–1)计算公式如下:
| $ Q_{P, i}= M_{H} C_{i}×10^{−4} $ | (6) |
式中,Ci为籽粒中重金属(i)的浓度,mg·kg–1;MH为水稻产量,kg·hm–2·a–1。
1.5 数据处理采用Excel 2021和SPSS 20.0进行单因素方差分析等数据处理,利用Origin 9.0作图。
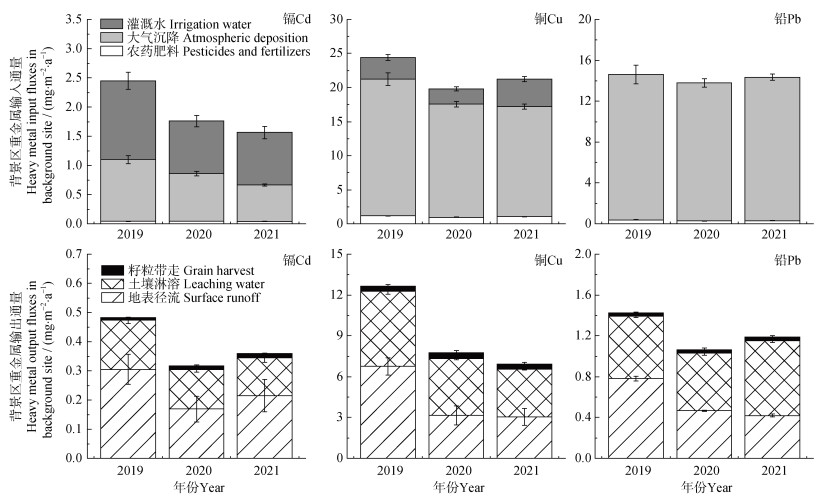
2 结果 2.1 背景区土壤重金属输入输出特征背景区土壤Cd、Cu、Pb的含量分别为0.22± 0.01、23.32±0.09、29.61±0.19 mg·kg–1,均未超过土壤环境质量-农用地土壤污染管控标准(GB 15618-2018)[22]中的Cd、Cu、Pb风险筛选值(pH < 5.5,Cd、Cu、Pb含量分别为0.3、50、80 mg·kg–1),土壤重金属输入输出特征见图 1。

|
图 1 背景区农田土壤重金属输入输出通量 Fig. 1 Heavy metals input and output fluxes of agricultural soils in background site |
背景区土壤Cd的主要输入途径是灌溉水,Cu、Pb的主要输入途径是大气沉降。根据定期灌溉水样品分析结果,背景区灌溉水中Cd、Cu浓度分别介于2.35~3.18、5.42~9.07 μg·L–1,Pb未检出;重金属含量均低于农田灌溉水质标准(GB 5084-2021)[23](Cd、Cu、Pb含量分别为10、500、200 μg·L–1)。2019-2021年,灌溉水中Cd的年输入通量分别为1.35±0.14、0.90±0.10、0.90±0.11 mg·m–2·a–1;Cu的年输入通量分别为3.15±0.45、2.25±0.33、4.05±0.39 mg·m–2·a–1。
试验中选用的农药肥料Cd、Pb含量远低于有机无机复混肥料标准(GB/T 18877-2020)[24](Cd、Pb含量分别为10、150 mg·kg–1),卤氧氟- r -甲基和钙镁磷肥施用量分别为450 mL·hm–2、300 kg·hm–2。2019-2021年,背景区农药肥料中Cd、Cu、Pb的年输入通量年际间无显著差异,Cd、Cu、Pb平均年输入通量分别为0.04±0.02、1.05±0.13、0.32± 0.04 mg·m–2·a–1。
大气沉降每月采集干、湿沉降后合计重金属沉降量,重金属沉降量与常年试验地降水量密切相关。2019-2021年,背景区大气沉降中Cd的年输入通量分别为1.06±0.07、0.82±0.04、0.63±0.02 mg·m–2·a–1,Cu的年输入通量分别为20.11±0.94、16.61±0.42、16.17± 0.35 mg·m–2·a–1,呈逐年下降趋势;Pb的年输入通量分别为14.23±0.90、13.53±0.41、14.04±0.33 mg·m–2·a–1。
背景区土壤Cd、Cu、Pb的主要输出途径均为地表径流和土壤淋溶,其次是籽粒带走。2019-2021年,因地表径流和的土壤淋溶导致的土壤Cd、Cu、Pb年平均输出通量分别为0.37±0.09、6.55±3.09、1.19±0.18 mg·m–2·a–1。该区域水稻重金属不存在超标情况,籽粒中Cd、Cu、Pb的含量均低于食品安全国家标准-食品中污染物限量(GB 2762-2022)[25](Cd、Pb含量均为0.2 mg·kg–1),经水稻籽粒带走的土壤Cd、Cu、Pb年平均通量无显著差异,分别为0.01±0.01、0.39±0.03、0.04±0.01 mg·m–2·a–1。
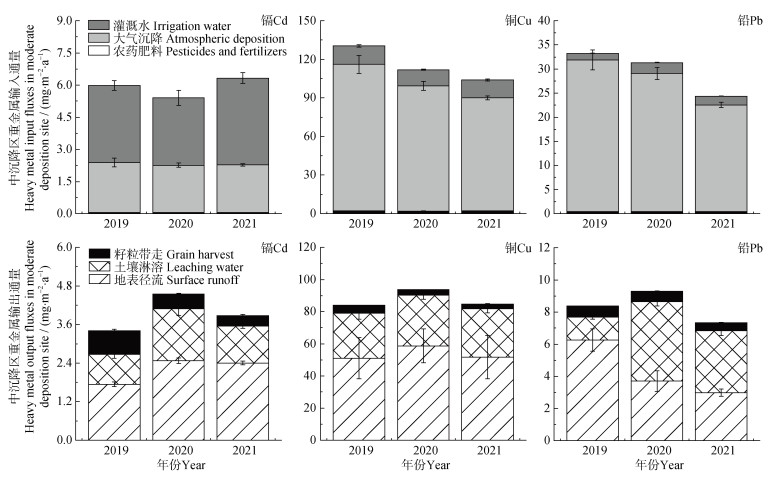
2.2 中沉降区土壤重金属输入输出特征中沉降区土壤Cd、Cu、Pb含量分别为0.69± 0.03、606.52±7.52、67.20±1.52 mg·kg–1,其中Cd、Cu分别超过GB 15618-2018[22]中Cd、Cu风险筛选值的2.30倍、12.13倍,Pb低于GB 15618-2018[22]中Pb风险筛选值,土壤重金属输入输出通量见图 2。

|
图 2 中沉降区农田土壤重金属输入输出通量 Fig. 2 Heavy metals input and output fluxes of agricultural soils in moderate deposition site |
中沉降区土壤Cd的主要输入途径是灌溉水,Cu、Pb的主要输入途径是大气沉降。根据定期灌溉水样品分析结果,中沉降区灌溉水中Cd、Cu、Pb的浓度分别介于7.26~9.34、28.81~32.63、3.04~5.23 μg·L–1之间;重金属含量均低于GB 5084-2021[23]中农田灌溉水质标准值。2019-2021年,灌溉水中Cd的年输入通量分别为3.60±0.23、3.15±0.36、4.05±0.26 mg·m–2·a–1;Cu的年输入通量分别为14.40±0.90、12.60±0.52、13.95±0.73 mg·m–2·a–1;Pb的年输入通量分别为1.35±0.07、2.25±0.05、1.80±0.04 mg·m–2·a–1。
试验中选用的农药肥料Cd、Pb含量远低于GB 18877-2020[24]中有机–无机复混肥料标准值,卤氧氟- r -甲基、钙镁磷肥和土壤改良剂施用量分别为450 mL·hm–2、300 kg·hm–2、1500 kg·hm–2。2019-2021年,中沉降区农药肥料中Cd、Cu、Pb的年输入通量年际间无显著差异,Cd、Cu、Pb平均年输入通量分别为0.05±0.03、2.03±0.17、0.41±0.15 mg·m–2·a–1。
大气沉降每月采集计算,2019-2021年,中沉降区大气沉降中Cd的年输入通量分别为2.34±0.20、2.21±0.10、2.22±0.06 mg·m–2·a–1;Cu的年输入通量分别为113.9±6.98、97.29±3.46、87.78±1.55 mg·m–2·a–1,Pb的年输入通量分别为31.48±2.04、28.69±1.26、22.13±0.56 mg·m–2·a–1,呈逐年下降趋势。
中沉降区土壤Cd、Cu、Pb的主要输出途径均为地表径流和土壤淋溶,其次是籽粒带走。2019-2021年,因地表径流和的土壤淋溶导致的土壤Cd、Cu、Pb年平均输出通量分别为3.44±0.72、83.62±5.83、7.72±0.92 mg·m–2·a–1;该区域水稻Cd、Pb存在轻度超标情况,经水稻籽粒带走的土壤Cd、Cu、Pb年平均输出通量分别为0.51±0.21、3.82±0.98、0.62±0.10 mg·m–2·a–1。
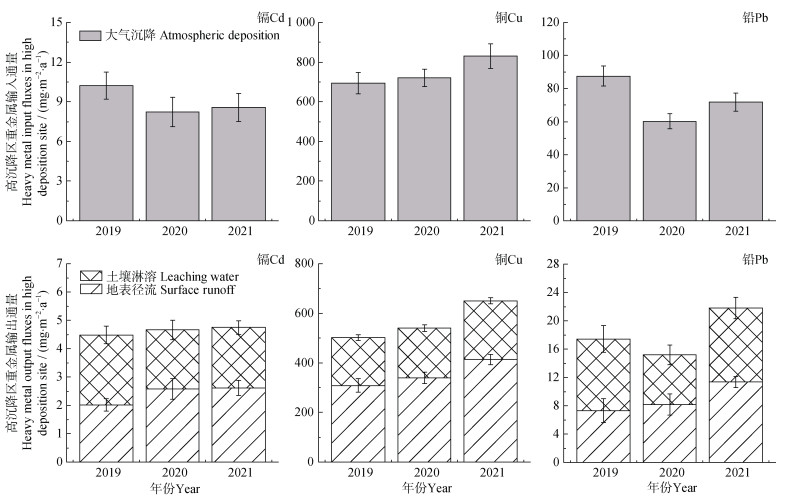
2.3 高沉降区土壤重金属输入输出特征高沉降区土壤(休耕地)Cd、Cu、Pb含量分别为8.80±0.56、928.30±6.67、59.91±0.43 mg·kg–1,其中Cd、Cu分别超过GB 15618-2018[22]中Cd、Cu风险筛选值的29.33倍、18.57倍,Pb低于GB 15618- 2018[22]中Pb风险筛选值,土壤重金属输入输出通量见图 3。

|
图 3 高沉降区农田土壤重金属输入输出通量 Fig. 3 Heavy metals input and output fluxes of agricultural soils in high deposition site |
高沉降区土壤Cd、Cu、Pb的来源为大气沉降。2019-2021年,大气沉降中Cd的年输入通量分别为10.22±1.03、8.24±1.12、8.57±1.06 mg·m–2·a–1;Cu的年输入通量分别为693.5±53.84、720.1±42.88、829.3±62.16 mg·m–2·a–1;Pb的年输入通量分别为87.52±6.14、60.21±4.54、71.78±5.56 mg·m–2·a–1。
高沉降区土壤Cd、Cu、Pb的主要输出途径为地表径流和土壤淋溶。2019-2021年,因地表径流导致的土壤Cd、Cu、Pb年平均输出通量分别为2.40±0.34、354.03±53.86、8.94±2.11 mg·m–2·a–1;因土壤淋溶导致的土壤Cd、Cu、Pb年平均输出通量分别为2.23±0.21、209.6±23.04、9.19±1.90 mg·m–2·a–1。
2.4 土壤重金属输入输出平衡估算根据上述土壤重金属输入输出特征,背景区、中沉降区、高沉降区耕层土壤重金属年平均净输入通量无显著差异(图 1~图 3)。经过地表径流、土壤淋溶和籽粒带走,研究区域耕层土壤重金属的净输入通量均大于0。2019-2021年,背景区Cd、Cu、Pb的年平均净输入通量分别为1.54±0.39、12.72± 1.38、13.03±0.26 mg·m–2·a–1;中沉降区Cd、Cu、Pb的年平均净输入通量分别为1.96±0.95、28.02±16.11、21.31±3.96 mg·m–2·a–1;高沉降区Cd、Cu、Pb的年平均净输入通量分别为4.38±1.18、184.0±6.50、55.04±13.28 mg·m–2·a–1。
由表 2可知,研究区域耕层土壤Cd、Cu、Pb的主要输入途径为大气沉降和灌溉水。背景区、中沉降区、高沉降区因大气沉降导致的Cd年平均输入量占比分别为43.18%、38.33%和100%;Cu、Pb年平均输入量占比均超过80%。背景区、中沉降区经灌溉导致的Cd年平均输入量占比分别为54.62%、60.82%;农药肥料带入的Cd年平均输入量占比介于0.85%~4.80%之间。不同大气沉降区耕层土壤Cd、Cu、Pb的主要输出途径是地表径流和土壤淋溶,合计年平均输入量占比均超过85%;因籽粒收获带走的重金属输出占比介于2.88%~13.34%之间。
|
|
表 2 研究区域土壤重金属输入输出途径占比估算 Table 2 Input-output assessment of heavy metals in study areas |
根据《土壤环境质量农用地土壤污染管控标准》(GB15618-2018)[22],土壤pH≤5.5时,水稻田土壤Cd、Cu、Pb的风险筛选值分别为0.3、50、80 mg·kg–1。本研究中,背景区农田土壤Cd、Cu、Pb含量及中、高沉降区农田土壤Pb含量均低于风险筛选值;中沉降区土壤Cd、Cu含量分别高于风险筛选值2.30倍、12.13倍;高沉降区土壤Cd、Cu含量分别高于风险筛选值29.33倍、18.56倍(表 1)。过度的工业活动使得周边的农田表层土壤中的重金属污染较重,重金属在贵溪冶炼厂附近的空间分布较高,说明土壤重金属可能来自相同或相似的点源。不同地区农田土壤因耕作方式和重金属来源不同,使得土壤重金属输入输出特征存在显著差异[26]。为进一步量化农业耕层土壤中重金属的来源,本研究通过化学质量平衡方法对土壤重金属的主要输入(大气沉降、灌溉水、农药肥料)和输出(地表径流、土壤淋溶、籽粒带走)途径开展分析。
3.1 耕层土壤重金属输入分析大气沉降和灌溉水是本研究区域农田土壤主要的重金属来源,其次是农药肥料。高沉降区大气沉降中Cd、Cu和Pb的年输入通量最高(图 3),这与高度工业化地区的哈尔滨和醴陵的研究结果[27-28]一致。此外,大气沉降中Cd、Cu和Pb表现出较高的生物有效性,可显著增加土壤重金属的生物有效性组分和作物重金属积累[29]。结合本研究区域前期研究结果,中沉降区、高沉降区大气沉降的Cd占耕层土壤全Cd的0.8%~5.5%;其中,水稻生长期间大气沉降贡献了水稻籽粒中Cd的27%~45% [18]。因此,大气沉降带来的重金属具有双重危害,减少大气沉降带来的Cd、Cu和Pb对农业生态系统的影响可有效降低生态风险。灌溉用水是农田土壤,特别是污灌区水稻田重金属的主要来源,如沈阳污灌区[11]。不同地区灌溉水重金属输入通量由于灌溉水水质的差异及农作物种类而呈现出较大的空间差异,水田灌溉的水质标准应较旱地更为严格[30]。本研究中,除了高沉降区灌溉水中Cd以外,其他区域灌溉水中重金属含量均未超过《农田灌溉水质标准》(GB 5084-2021)[23]。因此,在研究区域水稻实际生产过程中,可选择长期监测背景区和中沉降区灌溉水重金属含量,并密切关注因大气沉降导致的冶炼厂周边农田耕层土壤重金属的输入。
农药肥料作为耕地土壤中重要的潜在重金属来源,是欧洲国家农田土壤重金属输入的重要途径[31]。如,磷肥是法国农田土壤Cd的主要来源,占法国农业土壤全Cd投入的1/2以上[32-33]。我国农田土壤因农药肥料带入的重金属含量相对较少,例如松嫩平原土壤通过施肥输入Cd、Cu、Pb的通量范围分别为0.001~0.255、0.06~2.83、0.05~1.08 mg·m–2·a–1 [27];中国沈阳张石灌区土壤通过杀虫剂(恶二氮、毒死蜱和多菌灵)输入的Cd通量为2.0×10⁻⁶ mg·m–2·a–1 [11]。本研究区域(背景区、中沉降区、高沉降区)农药肥料的Cd、Cu和Pb年输入通量分别为0.04~0.05、1.05~2.13、0.30~0.41 mg·m–2·a–1,年输入通量占比介于0.79%~4.84%之间,可忽略不计(图 1~图 3,表 2)。值得注意的是,农业生产中施用的肥料中重金属含量应低于《有机无机复混肥料标准》(GB/T 18877-2020)[24];农药重金属年输入通量的地区差异可能与农药肥料种类以及农药重金属含量缺乏控制标准有关。
3.2 耕层土壤重金属输出分析地表径流和土壤淋溶是农业土壤中重金属的主要输出途径,这与研究区域降水量、灌溉水用量及重金属背景值、土壤自身渗透速率有关[34-35]。本研究中,背景区、中沉降区、高沉降区耕层土壤重金属的主要输出途径为地表径流,其次是土壤淋溶、籽粒带走(表 2)。通过土壤淋溶的重金属输出通量低于地表径流,这是由于淋滤过程中土壤有机质和矿物氧化物对Cd、Cu和Pb的吸附,使得土壤的渗滤速率较慢,这与成都经济区和长江三角洲的研究结果[27]一致。作物带走作为土壤重金属另一个重要输出途径,重金属通量占比存在不确定性。如,河北省石家庄市东南部典型污灌区农业土壤,通过作物各部位收获带走的Cd输出通量为0.09 mg·m–2·a–1,占比达86.66%[14]。本研究中,根据区域水稻常规种植模式,水稻秸秆在收获时全部还田;背景区和中沉降区通过籽粒带走的重金属通量占比较低,介于2.88%~13.34%(表 2)。因此,籽粒带走并非铜冶炼厂周边农业耕层土壤重金属的主要输出途径,土壤中重金属的转化和向作物体内的迁移尚有待进一步研究。
总体而言,背景区和中沉降区按照当地常规模式进行水稻生产,在秸秆全部还田、经大气沉降和灌溉水多年重金属持续输入的情况下,很难保证农田耕层土壤重金属输入输出平衡;高沉降区休耕地应根据土壤重金属实际污染情况,科学选择替代作物,积极推进种植结构调整,加强耕地的修复治理,实现农业可持续发展。
4 结论本研究区域农田耕层土壤属于Cd、Cu复合污染,大气沉降和灌溉水是农业系统土壤重金属积累的主要来源。2019-2021年,背景区和中沉降区耕层土壤中的Cd主要来自灌溉水,主要输出途径为地表径流;高沉降区耕层土壤中的Cd来自大气沉降,主要输出途径为土壤淋溶。背景区、中沉降区和高沉降区耕层土壤中Cu和Pb主要来自大气沉降,主要输出途径为地表径流和土壤淋溶。综上,建议对背景区和中沉降区的灌溉水质开展长期监测,提高水稻秸秆资源化利用率、避免直接还田,同时加强大气污染源的监测并采取一定的控制措施。
| [1] |
Ministry of Environmental Protection, Ministry of Land and Resources. Report on the national general survey of soil contamination[R]. [2014-04-17]. https://www.gov.cn/foot/2014-04/17/content_2661768.htm. [[环境保护部, 国土资源部. 全国土壤污染状况调查公报[R]. [2014-04-17]. https://www.gov.cn/foot/2014-04/17/content_2661768.htm.]
(  0) 0) |
| [2] |
Ministry of Ecology and Environment of the People's Republic of China. Report on the China's ecological and environmental conditions[R]. [2022-05-26]. https://www.gov.cn/xinwen/2022-05/28/content_5692799.htm.[生态环境部. 2021年中国生态环境状况公报[R]. [2022-05-26]. https://www.gov.cn/xinwen/2022-05/28/content_5692799.htm.]
(  0) 0) |
| [3] |
Sterckeman T, Gossiaux L, Guimont S, et al. Cadmium mass balance in French soils under annual crops: Scenarios for the next century[J]. Science of the Total Environment, 2018, 639: 1440-1452. DOI:10.1016/j.scitotenv.2018.05.225
(  0) 0) |
| [4] |
Bigalke M, Ulrich A, Rehmus A, et al. Accumulation of cadmium and uranium in arable soils in Switzerland[J]. Environmental Pollution, 2017, 221: 85-93. DOI:10.1016/j.envpol.2016.11.035
(  0) 0) |
| [5] |
Salman S A, Elnazer A A, El Nazer H A. Integrated mass balance of some heavy metals fluxes in Yaakob Village, South Sohag, Egypt[J]. International Journal of Environmental Science and Technology, 2017, 14(5): 1011-1018. DOI:10.1007/s13762-016-1200-3
(  0) 0) |
| [6] |
de Vries W, McLaughlin M J. Modeling the cadmium balance in Australian agricultural systems in view of potential impacts on food and water quality[J]. Science of the Total Environment, 2013, 461: 240-257.
(  0) 0) |
| [7] |
Chen Y L, Weng L P, Ma J, et al. Review on the last ten years of research on source identification of heavy metal pollution in soils (In Chinese)[J]. Journal of Agro-Environment Science, 2019, 38(10): 2219-2238. DOI:10.11654/jaes.2018-1449 [陈雅丽, 翁莉萍, 马杰, 等. 近十年中国土壤重金属污染源解析研究进展[J]. 农业环境科学学报, 2019, 38(10): 2219-2238.]
(  0) 0) |
| [8] |
Li X X, Liu H Y, Meng W, et al. Accumulation and source apportionment of heavy metal(loid)s in agricultural soils based on GIS, SOM and PMF: A case study in superposition areas of geochemical anomalies and zinc smelting, Southwest China[J]. Process Safety and Environmental Protection, 2022, 159: 964-977. DOI:10.1016/j.psep.2022.01.072
(  0) 0) |
| [9] |
Su H Y, Hu Y M, Wang L, et al. Source apportionment and geographic distribution of heavy metals and as in soils and vegetables using kriging interpolation and positive matrix factorization analysis[J]. International Journal of Environmental Research and Public Health, 2022, 19(1): 485-502. DOI:10.3390/ijerph19010485
(  0) 0) |
| [10] |
Xia Z S, Bai Y R, Wang Y Q, et al. Spatial distribution and source analysis of soil heavy metals in a small watershed in the mountainous area of southern Ningxia based on PMF model (In Chinese)[J]. Environmental Science, 2022, 43(1): 432-441. [夏子书, 白一茹, 王幼奇, 等. 基于PMF模型的宁南山区小流域土壤重金属空间分布及来源解析[J]. 环境科学, 2022, 43(1): 432-441.]
(  0) 0) |
| [11] |
Fu Y H, Li F M, Guo S H, et al. Cadmium concentration and its typical input and output fluxes in agricultural soil downstream of a heavy metal sewage irrigation area[J]. Journal of Hazardous Materials, 2021, 412: 125203. DOI:10.1016/j.jhazmat.2021.125203
(  0) 0) |
| [12] |
Liu Y B, Ma Z H, Liu G N, et al. Accumulation risk and source apportionment of heavy metals in different types of farmland in a typical farming area of northern China[J]. Environmental Geochemistry and Health, 2021, 43: 5177-5194. DOI:10.1007/s10653-021-01002-0
(  0) 0) |
| [13] |
Tang S S, Jiang K, Huang J, et al. Analysis of cadmium balance source in soil-rice system in a certain area of Xiangxiang City (In Chinese)[J]. Journal of Soil and Water Conservation, 2020, 34(2): 365-371. [唐盛爽, 蒋凯, 黄敬, 等. 湘乡市某地区土壤-水稻系统镉平衡源解析[J]. 水土保持学报, 2020, 34(2): 365-371.]
(  0) 0) |
| [14] |
Yan X L, Zhao W C, Yang X, et al. Input-output balance of cadmium in typical agriculture soils with historical sewage irrigation in China[J]. Journal of Environmental Management, 2020, 276: 111298. DOI:10.1016/j.jenvman.2020.111298
(  0) 0) |
| [15] |
Tong W B, Guo B, Lin Y C, et al. Assessment of input-output patterns of Cd and Pb of typical heavy metal polluted agricultural land in Quzhou (In Chinese)[J]. Journal of Nuclear Agricultural Sciences, 2020, 34(5): 1061-1069. [童文彬, 郭彬, 林义成, 等. 衢州典型重金属污染农田镉、铅输入输出平衡分析[J]. 核农学报, 2020, 34(5): 1061-1069.]
(  0) 0) |
| [16] |
Shi T R, Ma J, Wu X, et al. Inventories of heavy metal inputs and outputs to and from agricultural soils: A review[J]. Ecotoxicology and Environmental Safety, 2018, 164: 118-124. DOI:10.1016/j.ecoenv.2018.08.016
(  0) 0) |
| [17] |
Feng J S, Song N N, Yu Y X, et al. Differential analysis of FA-NNC, PCA-MLR, and PMF methods applied in source apportionment of PAHs in street dust[J]. Environmental Monitoring and Assessment, 2020, 192: 727. DOI:10.1007/s10661-020-08679-3
(  0) 0) |
| [18] |
Zhou J, Du B Y, Liu H L, et al. The bioavailability and contribution of the newly deposited heavy metals(copper and lead)from atmosphere to rice(Oryza sativa L.)[J]. Journal of Hazardous Materials, 2019, 384: 121285.
(  0) 0) |
| [19] |
Bao S D. Soil and agricultural chemistry analysis[M]. 3rd ed. Beijing: China Agriculture Press, 2000.[鲍士旦. 土壤农化分析[M]. 3版. 北京: 中国农业出版社, 2000.]
(  0) 0) |
| [20] |
Machado I, María V C, Mariela P. In vitro, bioaccessibility study of As, Cd, Cu, Fe, Ni, Pb and Zn from raw edible artichoke heads(Cynara cardunculus L. subsp. Cardunculus)[J]. Microchemical Journal, 2017, 133: 663-668. DOI:10.1016/j.microc.2017.03.005
(  0) 0) |
| [21] |
Tessier A, Campell P G C, Bisson M. Sequential extraction procedure for the speciation of particulate trace metals[J]. Analytical Chemistry, 1979, 51: 844-851. DOI:10.1021/ac50043a017
(  0) 0) |
| [22] |
Ministry of Ecology and Environment of the People's Republic of China. Soil environmental quality-Risk control standard for soil contamination of agricultural land: GB15618-2018[S]. Beijing: China Standard Press, 2018.[生态环境部. 土壤环境质量农用地土壤污染风险管控标准: GB 15618-2018[S]. 北京: 中国标准出版社, 2018.]
(  0) 0) |
| [23] |
Ministry of Ecology and Environment of the People's Republic of China. Standard for irrigation water quality: GB 5084-2021[S]. Beijing: China Standard Press, 2021.[生态环境部. 农田灌溉水质标准: GB 5084-2021[S]. 北京: 中国标准出版社, 2021.]
(  0) 0) |
| [24] |
State Administration for Market Regulation. Organic inorganic compound fertilizer: GB/T 18877-2020[S]. Beijing: China Standard Press, 2020.[国家市场监督管理总局. 有机无机复混肥料: GB/T 18877-2020[S]. 北京: 中国标准出版社, 2020.]
(  0) 0) |
| [25] |
National Health Commission of the People's Republic of China. National standard for food safety-Limits for contaminants in food: GB 2762-2022[S]. Beijing: China Standard Press, 2022.[中华人民共和国国家卫生健康委员会. 食品安全国家标准食品中污染物限量: GB 2762-2022[S]. 北京: 中国标准出版社, 2022.]
(  0) 0) |
| [26] |
Zhang H, Ma X P, Shi X L, et al. Influential factors of spatial distribution of Cd and Cr in regional soils (In Chinese)[J]. Soils, 2018, 50(5): 989-998. [张慧, 马鑫鹏, 史晓磊, 等. 区域土壤Cd和Cr空间分布的影响因素研究[J]. 土壤, 2018, 50(5): 989-998.]
(  0) 0) |
| [27] |
Xia X Q, Yang Z F, Cui Y J, et al. Soil heavy metal concentrations and their typical input and output fluxes on the southern Song-nen Plain, Heilongjiang Province, China[J]. Journal of Geochemical Exploration, 2014, 139(1): 85-96.
(  0) 0) |
| [28] |
Yi K X, Fan W, Chen J Y, et al. Annual input and output fluxes of heavy metals to paddy fields in four types of contaminated areas in Hunan Province, China[J]. Science of the Total Environment, 2018, 634: 67-76. DOI:10.1016/j.scitotenv.2018.03.294
(  0) 0) |
| [29] |
Liu H L, Zhou J, Li M, et al. Study of the bioavailability of heavy metals from atmospheric deposition on the soil-pakchoi(Brassica chinensis L.)system[J]. Journal of Hazardous Materials, 2019, 362: 9-16. DOI:10.1016/j.jhazmat.2018.09.032
(  0) 0) |
| [30] |
Christelle D, Lamy I, Oort F V, et al. Trace metal inputs reconstitution and migration assessment in a sandy Luvisol after 100 years of massive irrigation with raw wastewaters[J]. Comptes Rendus Geoscience, 2006, 338(8): 565-573. DOI:10.1016/j.crte.2006.02.006
(  0) 0) |
| [31] |
Lopes C, Herva M, Franco-Uría A, et al. Inventory of heavy metal content in organic waste applied as fertilizer in agriculture: Evaluating the risk of transfer into the food chain[J]. Environmental Science and Pollution Research, 2011, 18(6): 918-939. DOI:10.1007/s11356-011-0444-1
(  0) 0) |
| [32] |
Carne G, Leconte S, Sirot V, et al. Mass balance approach to assess the impact of cadmium decrease in mineral phosphate fertilizers on health risk: The case-study of French agricultural soils[J]. Science of the Total Environment, 2021, 760: 143374. DOI:10.1016/j.scitotenv.2020.143374
(  0) 0) |
| [33] |
Belon E, Boisson M, Deportes I Z, et al. An inventory of trace elements inputs to French agricultural soils[J]. Science of the Total Environment, 2012, 439: 87-95. DOI:10.1016/j.scitotenv.2012.09.011
(  0) 0) |
| [34] |
Li F B, Xu R K, Tan W F, et al. The frontier and perspectives of soil chemistry in the new era (In Chinese)[J]. Acta Pedologica Sinica, 2020, 57(5): 1088-1104. DOI:10.11766/trxb202003080103 [李芳柏, 徐仁扣, 谭文峰, 等. 新时代土壤化学前沿进展与展望[J]. 土壤学报, 2020, 57(5): 1088-1104.]
(  0) 0) |
| [35] |
Liu R, Wang J, Shi J, et al. Runoff characteristics and nutrient loss mechanism from plain farmland under simulated rainfall conditions[J]. Science of the Total Environment, 2014, 468: 1069-1077.
(  0) 0) |
 2024, Vol. 61


